Antibiotic prescription fill rates declining in the U.S.

Published August 24, 2017

Executive Summary

Nurse talking to a childThe overuse of antibiotics, which is known to cause antibiotic-resistant bacteria, has been a topic of concern among healthcare professionals and policy makers in America for many years.1 In particular, the use of broad-spectrum antibiotics to treat a wide range of bacteria has been found to create antibiotic-resistant strains of bacteria. These resistant bacteria are immune to common medications and are difficult to treat.2

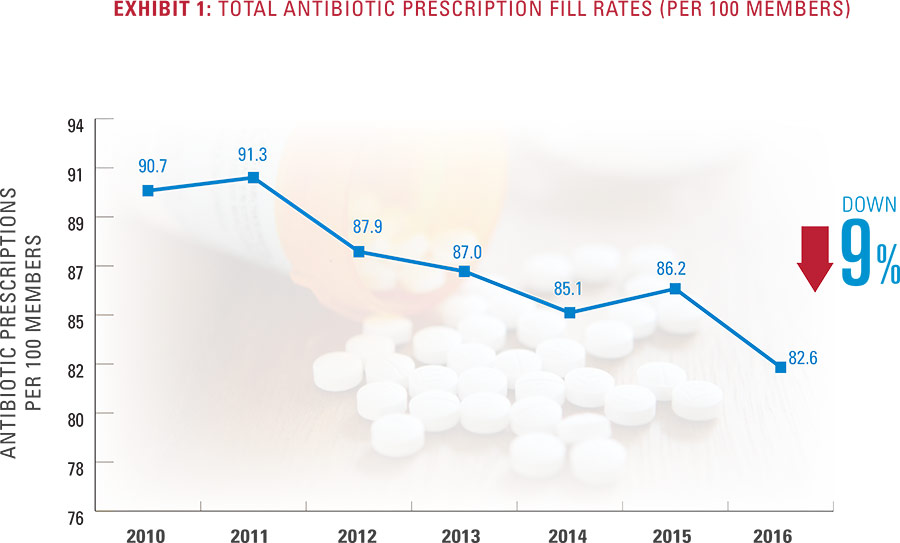
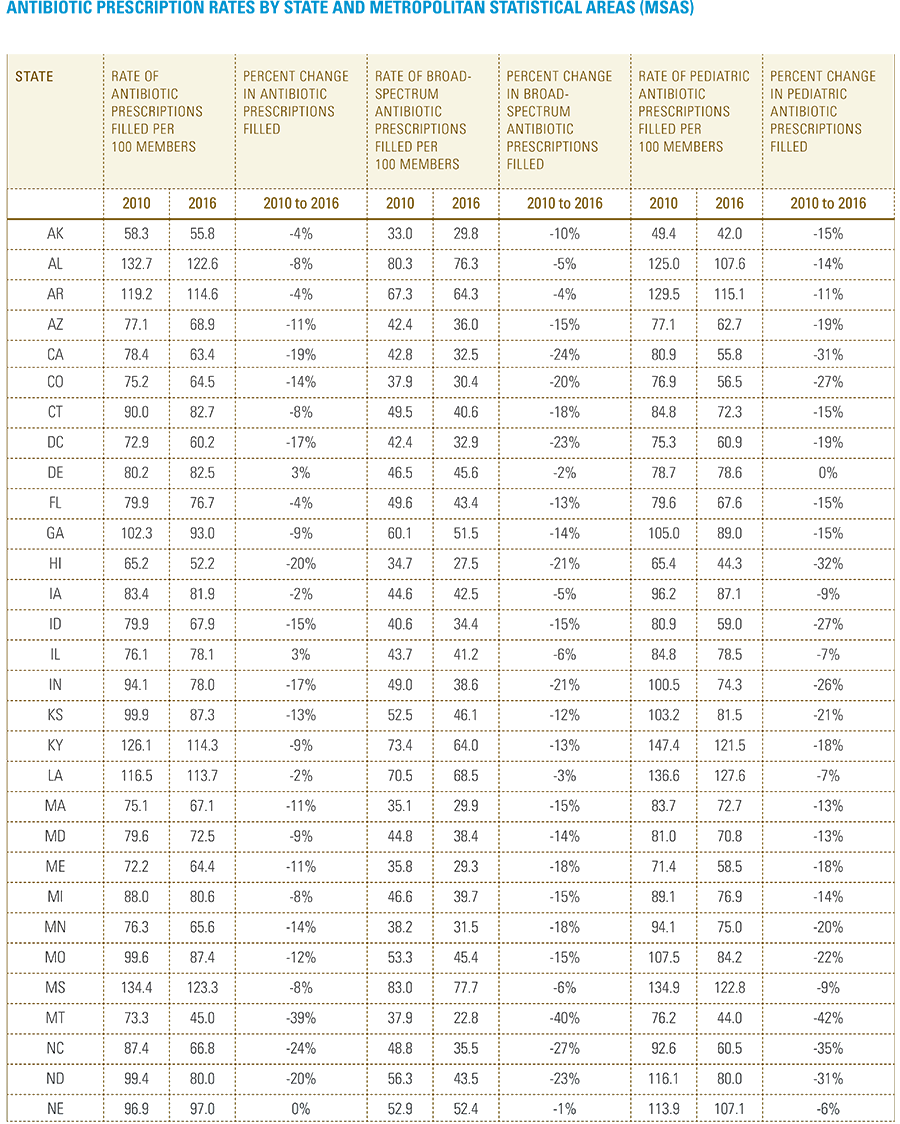
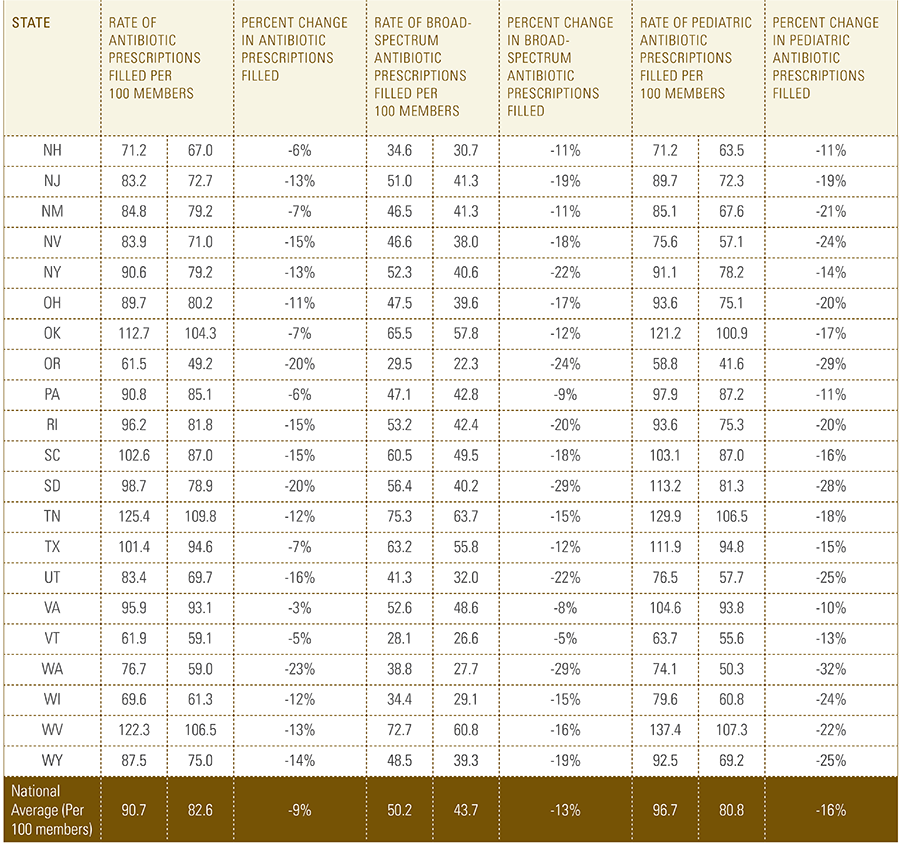
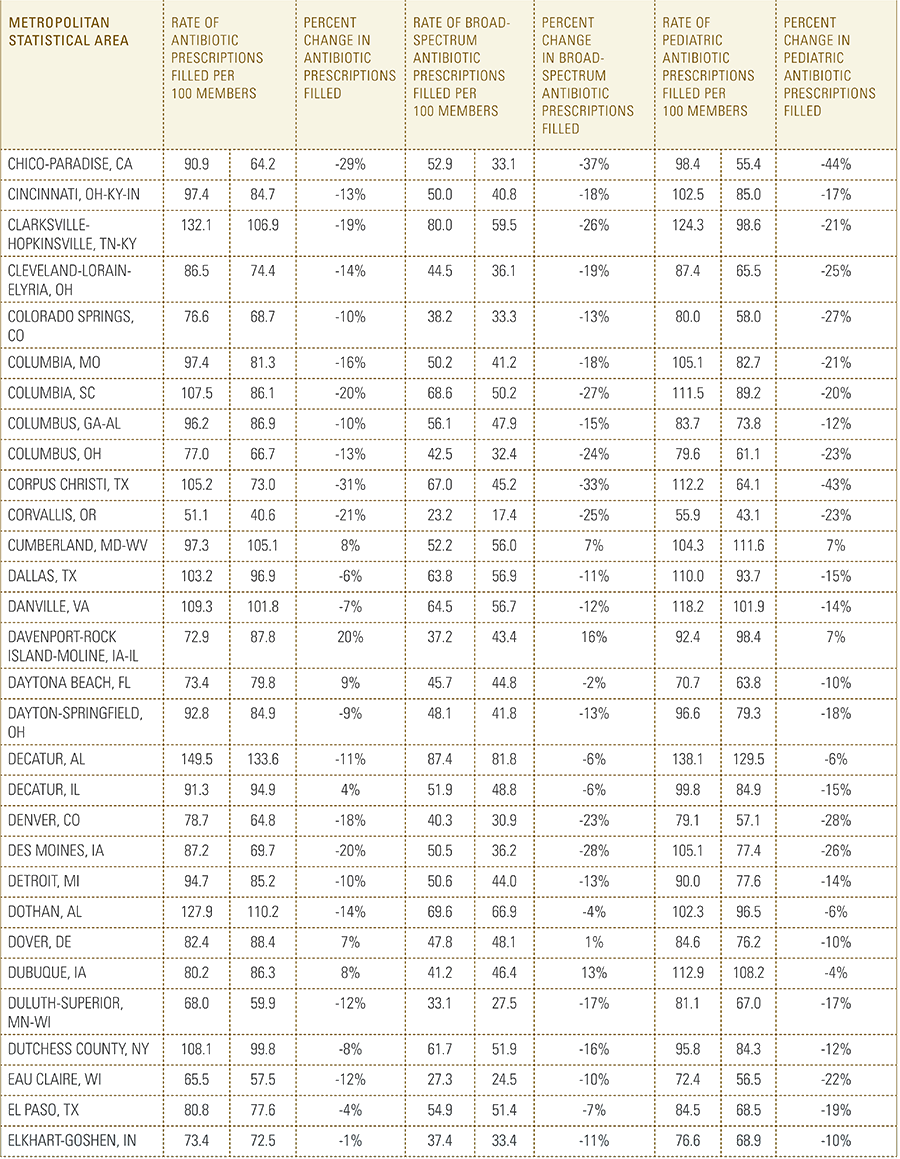
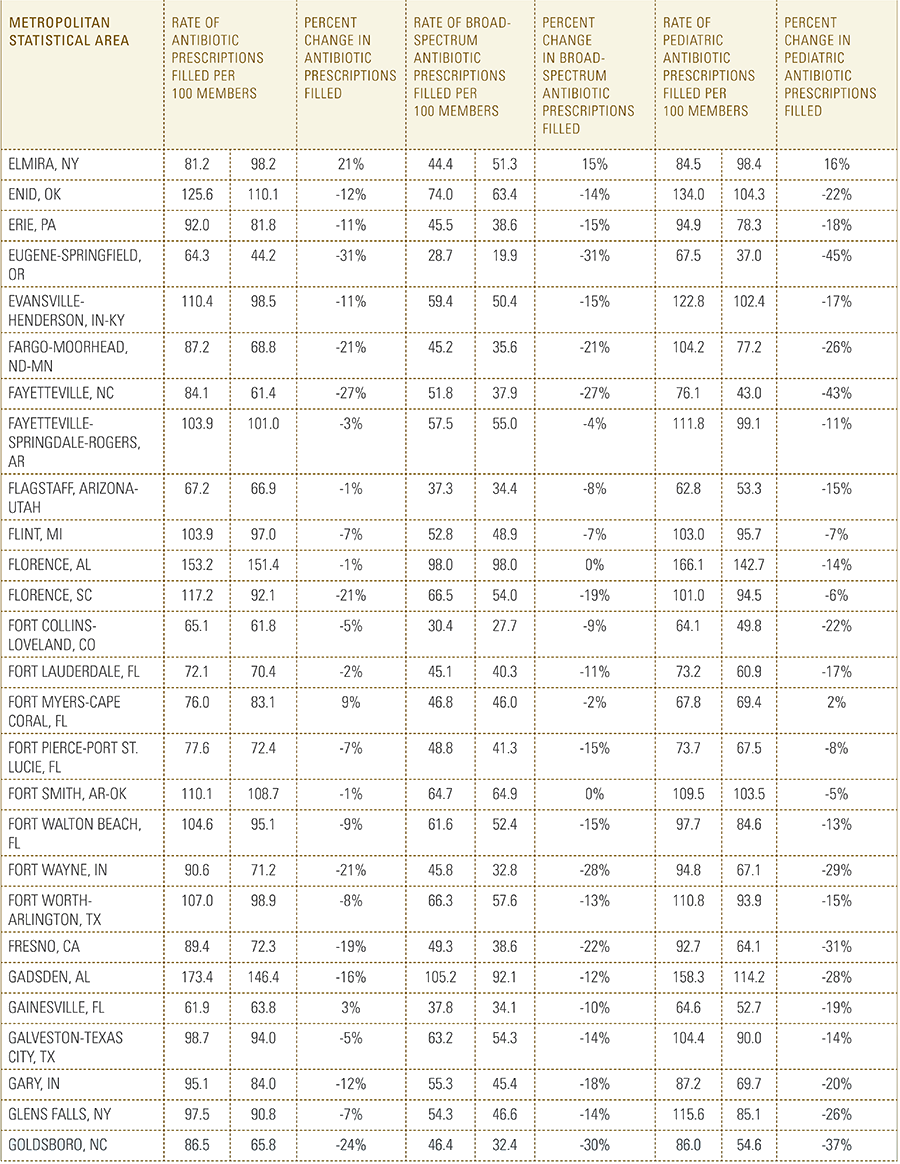
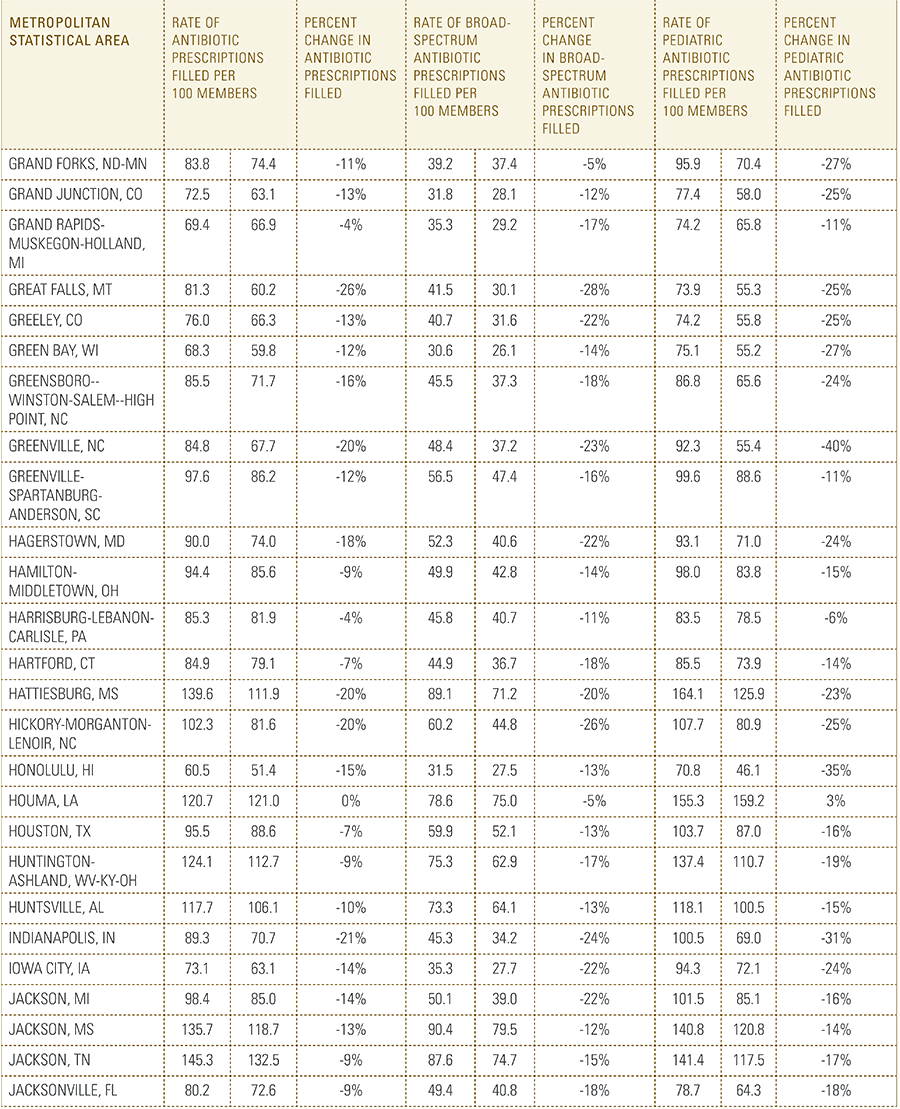
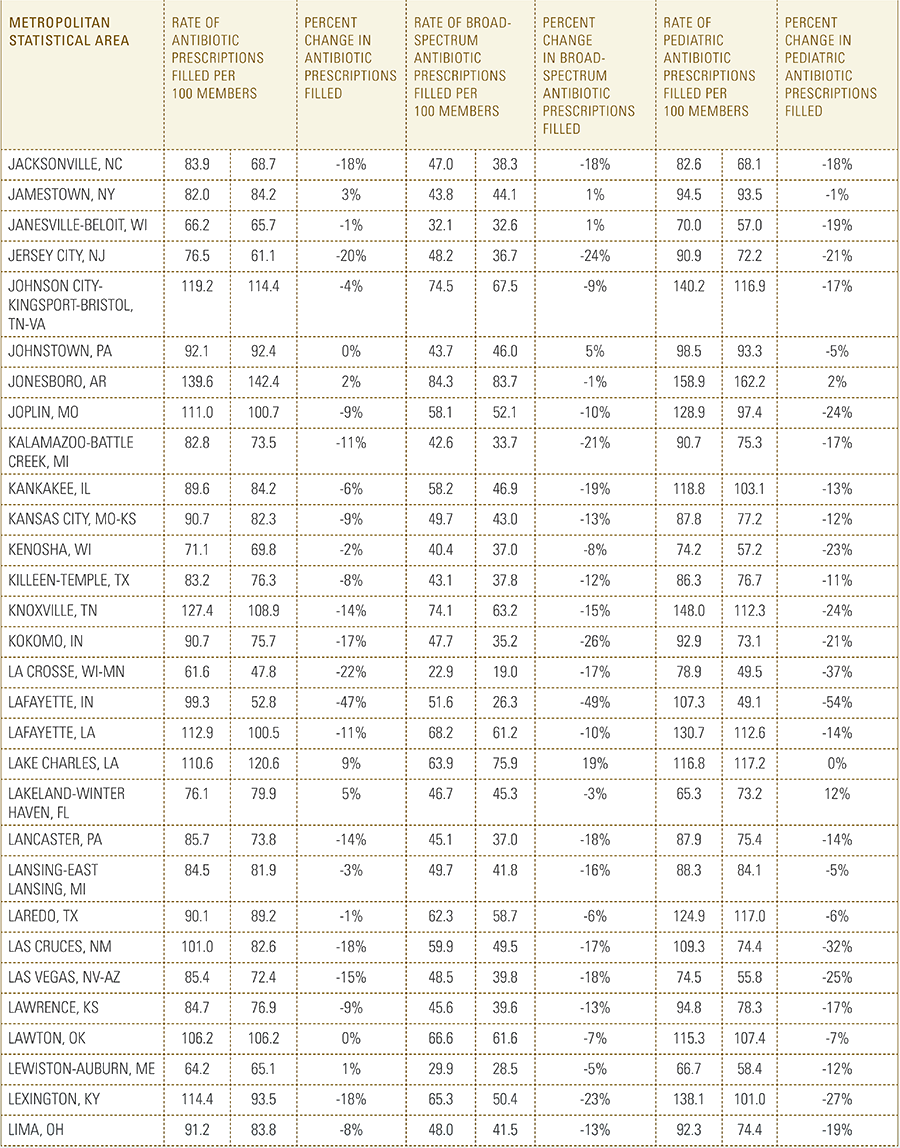
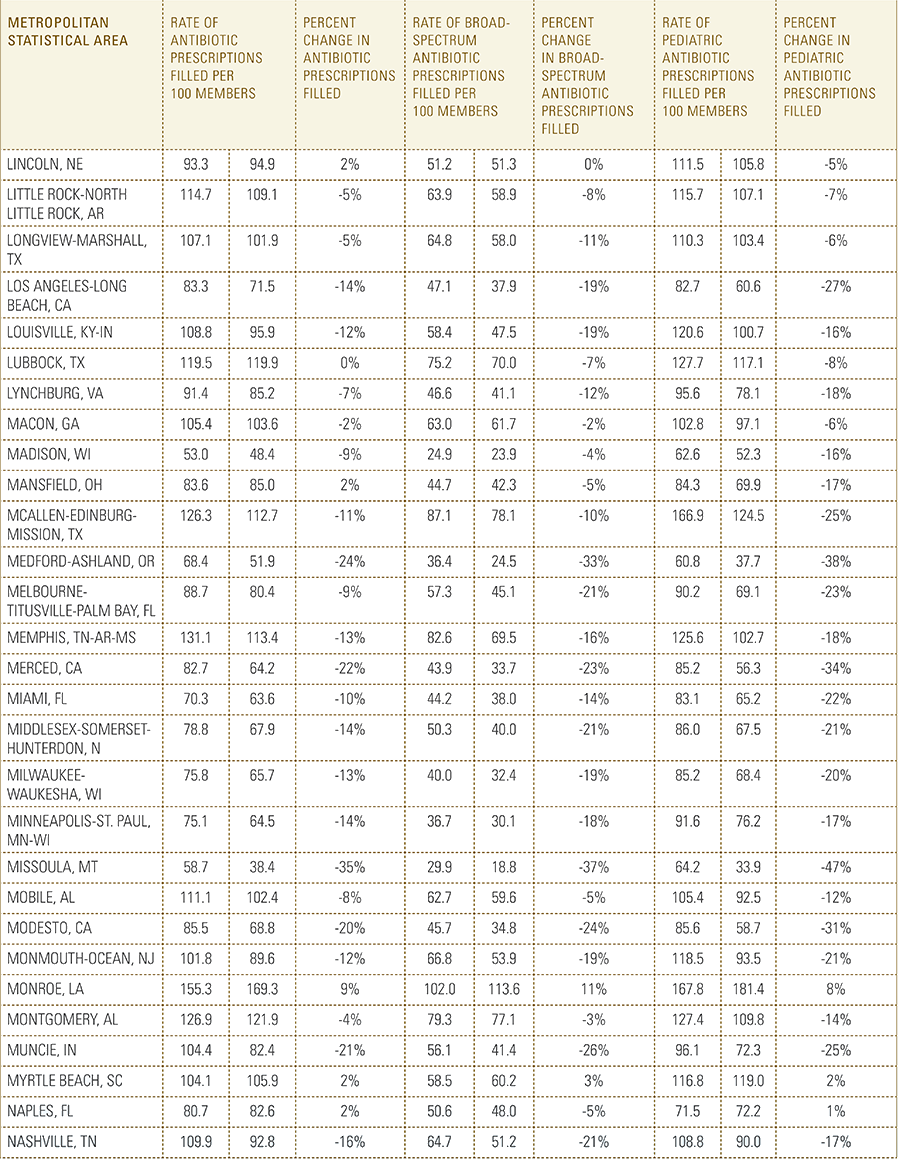
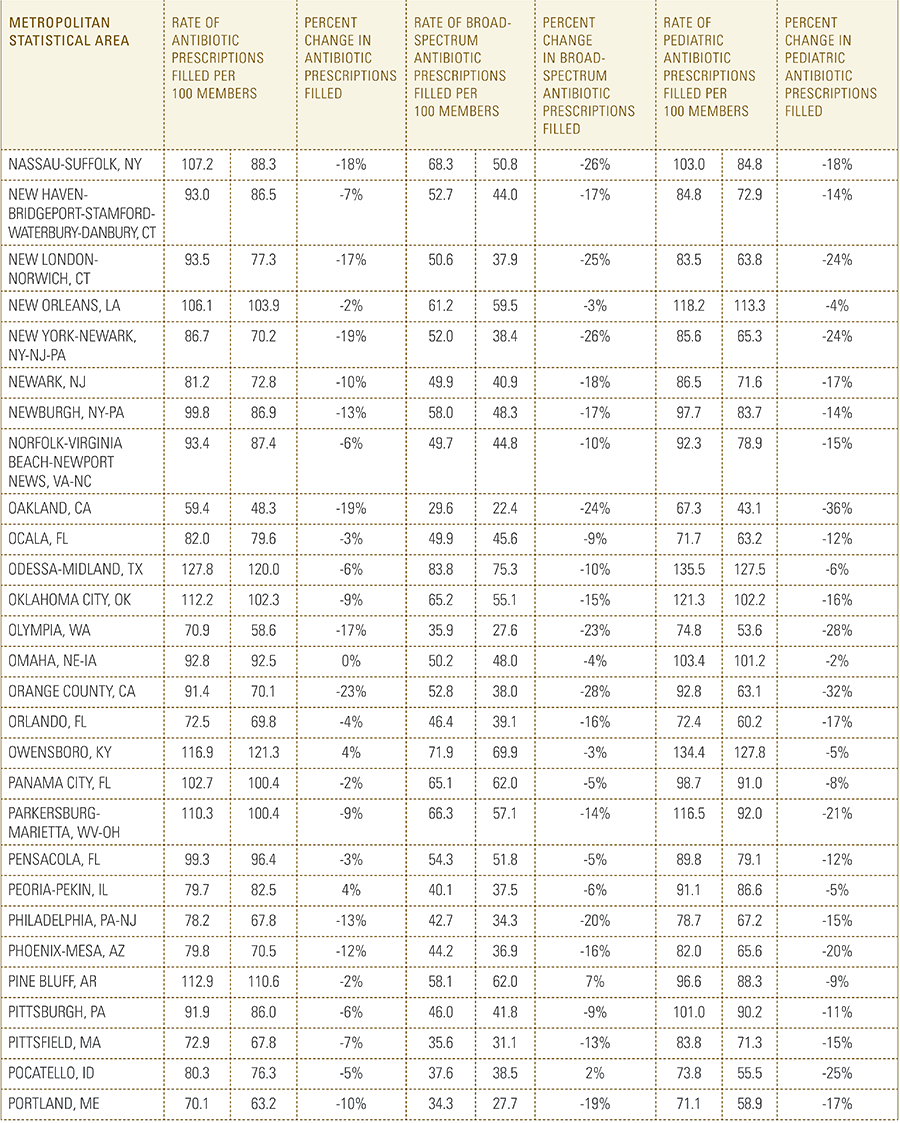
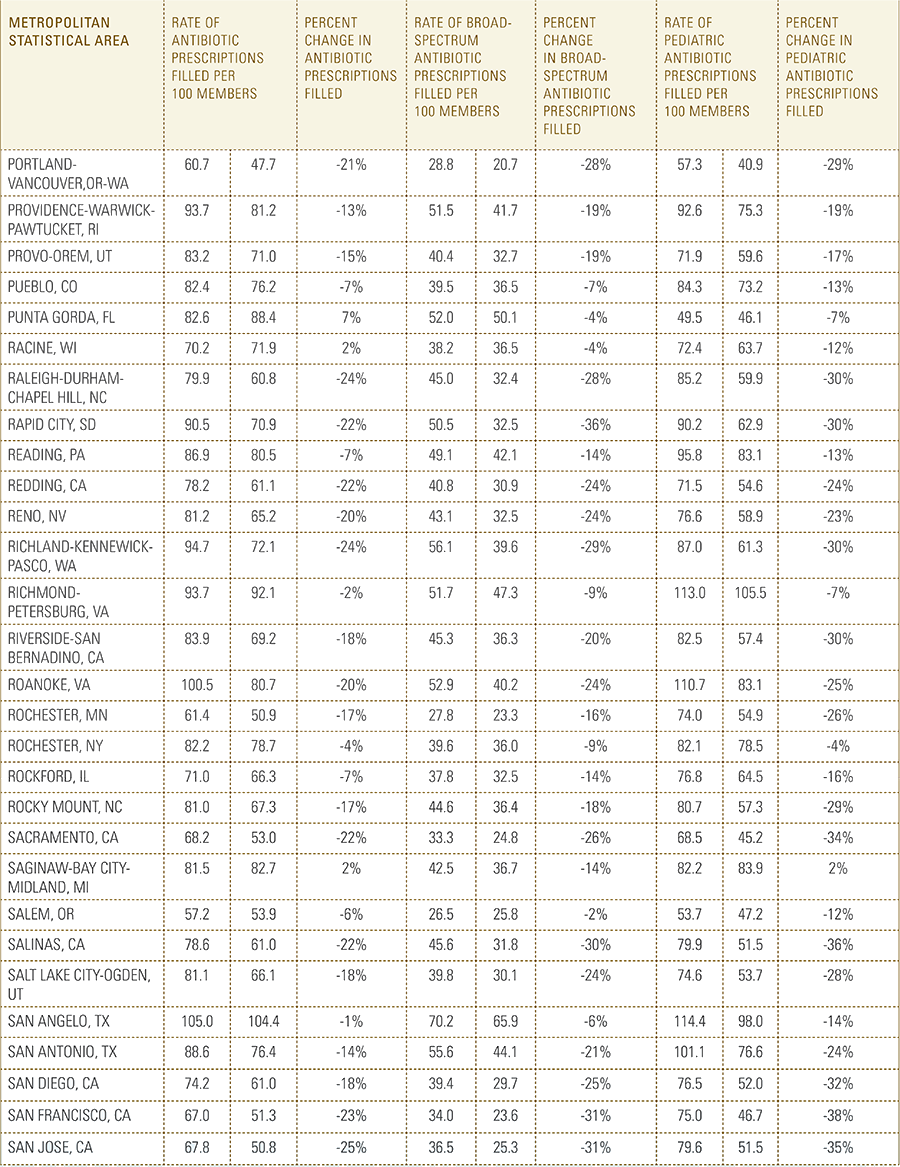
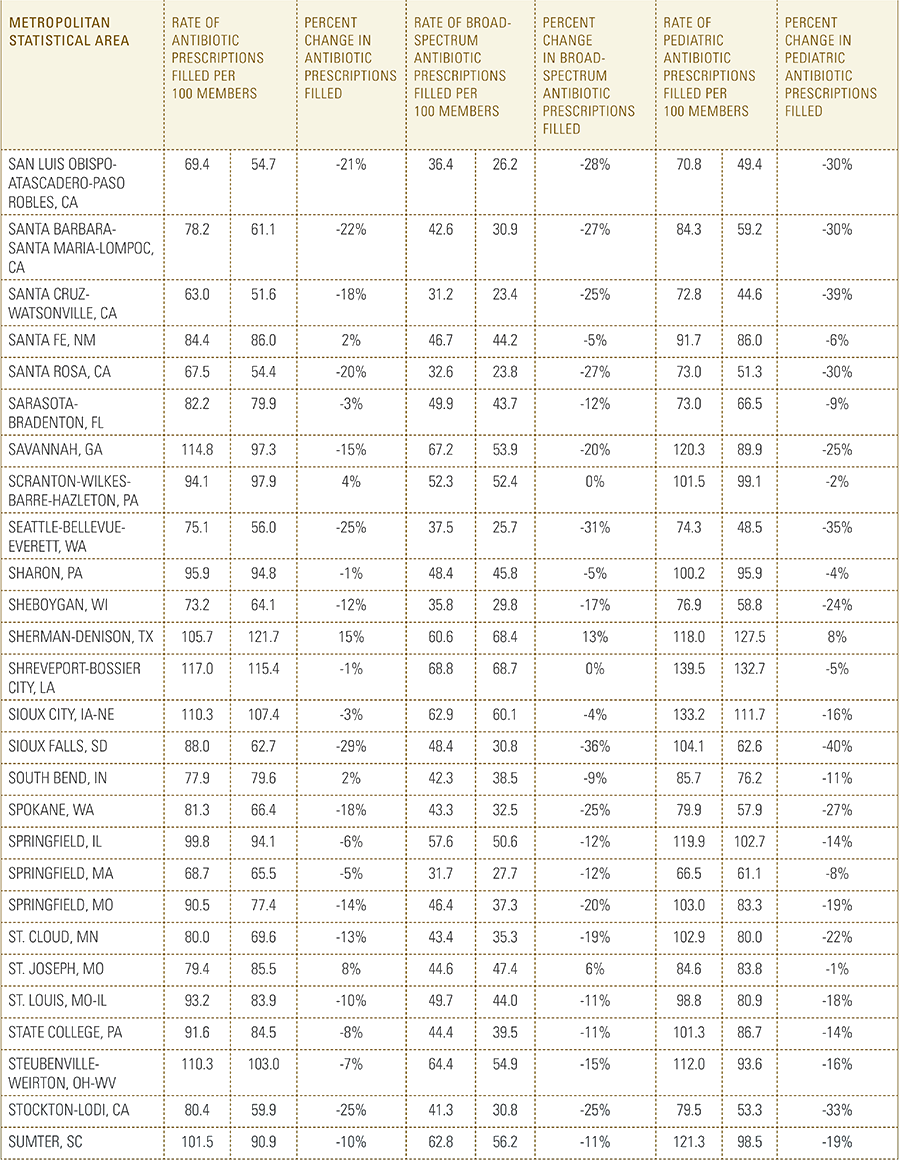
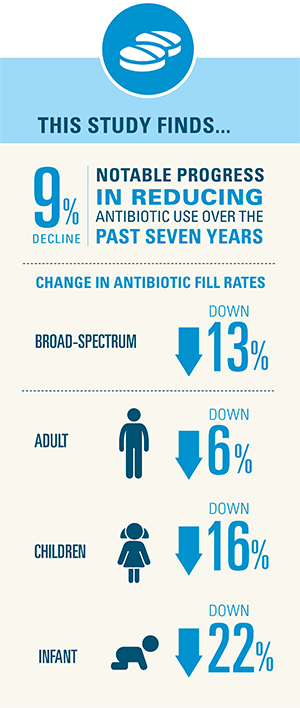
Since 2010, antibiotic prescription rates in the U.S. have been declining among the commercially insured population, falling 9 percent during this period. This decline indicates that considerable progress is being made in public health campaigns to limit the use of antibiotics and prevent the development of antibiotic-resistant bacteria.

The Analysis

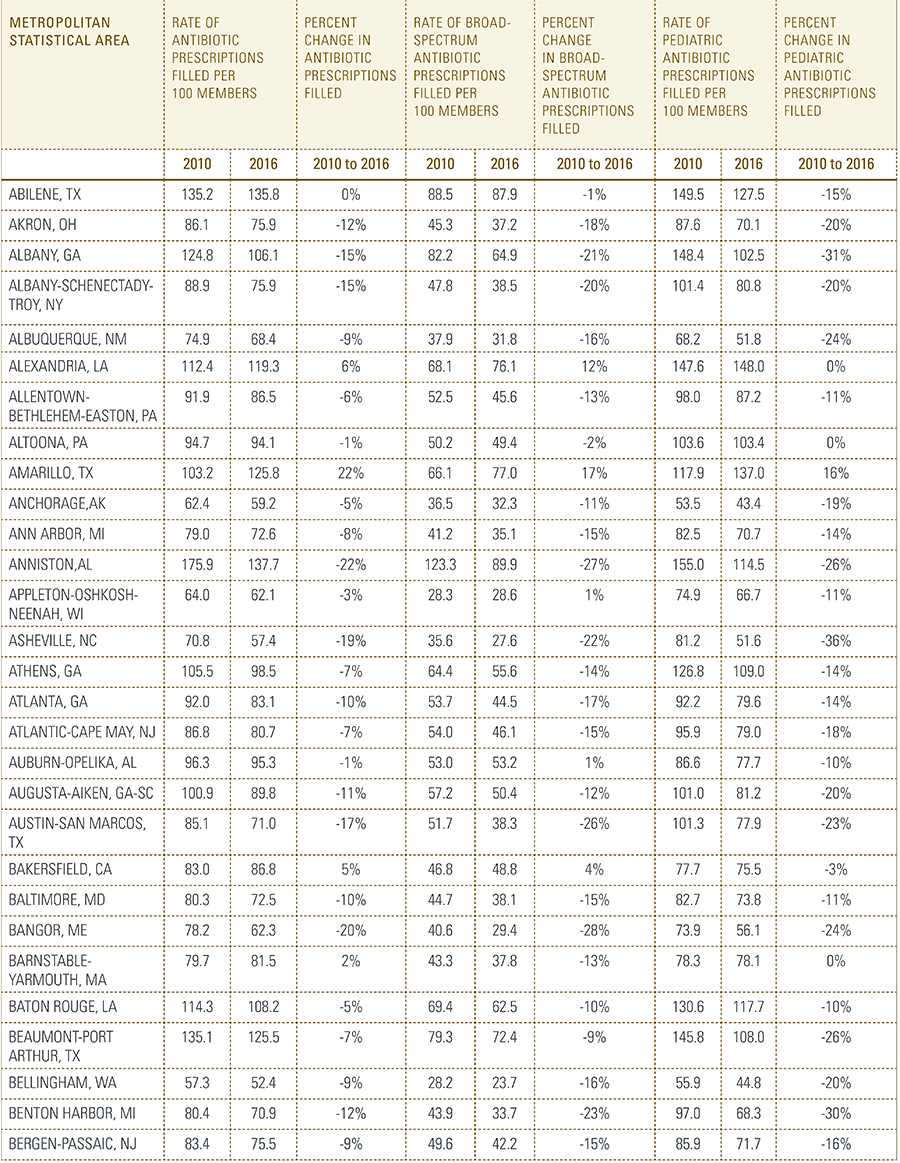
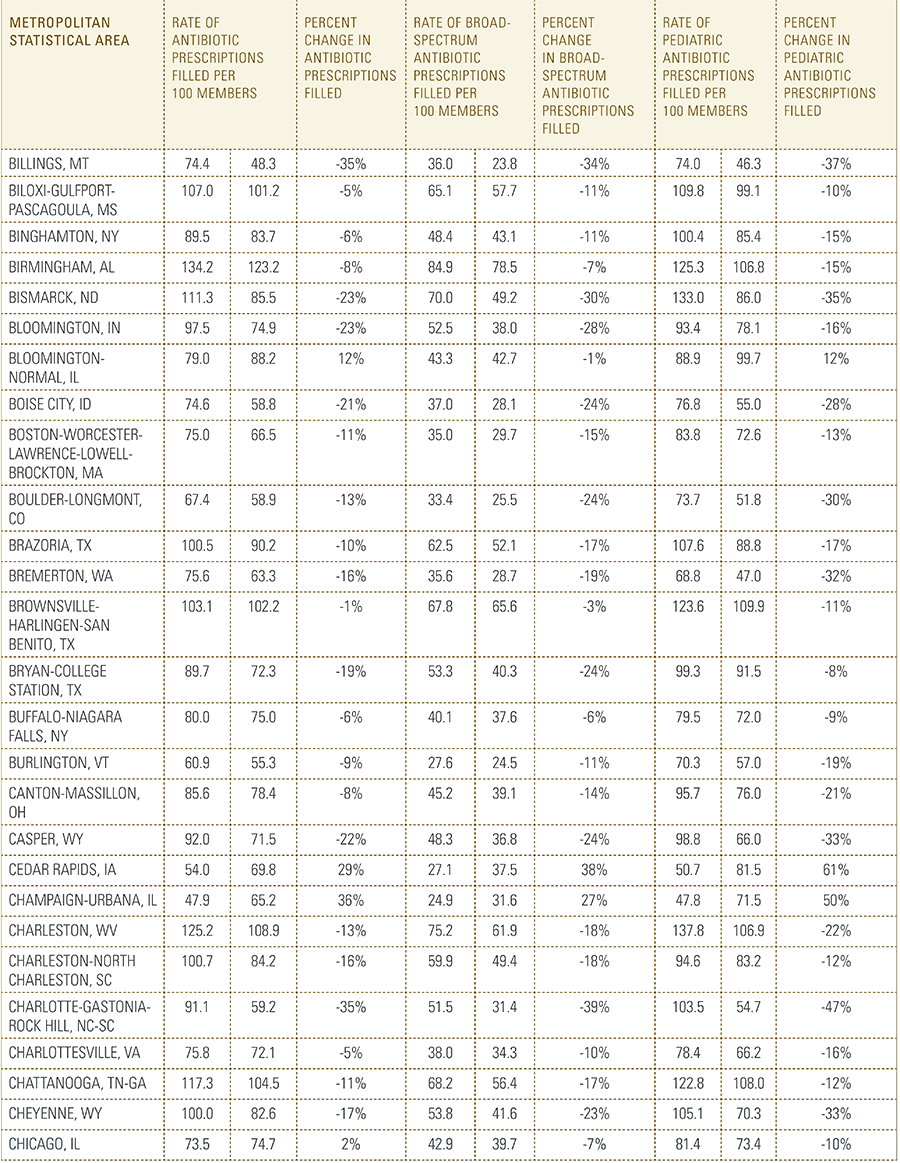
In this report, the Blue Cross Blue Shield Association, in partnership with HealthCore and Blue Health Intelligence, examine antibiotic prescriptions filled by commercially insured members from 2010 to 2016 as a result of an outpatient visit. Antibiotics administered as part of an inpatient visit were not included in this study. The scope of the research included 173 million patient claims for filled antibiotic prescriptions from over 31 million commercially insured Americans under age 65. This report includes antibiotics that were prescribed to and filled by a patient (referred to here as the antibiotic prescription fill rate), and are thereby considered as antibiotics used to treat a patient’s condition.

This study finds a 9% decline. Notable progress in reducing antibiotic use over the past seven yearsSummary of Key Findings
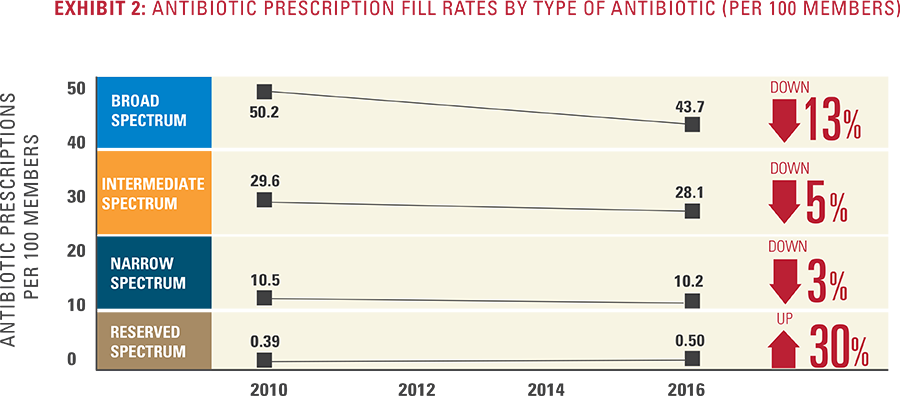
  • The fill rate of outpatient antibiotic prescriptions declined 9 percent among commercially insured Americans from 2010 to 2016.
  • Broad-spectrum antibiotic fill rates dropped the most at 13 percent. Broad-spectrum antibiotics are the type most likely to facilitate the creation of antibiotic-resistant bacteria. (See below for a description of each type of antibiotic discussed in this report.)
  • The drop in antibiotic fill rates was significantly greater in children (16 percent) when compared to adults (6 percent), with infants experiencing the steepest decline (22 percent).
  • Wide regional variation in antibiotic prescription fill rates exists, with the highest-prescribing states filling nearly three times as many prescriptions per person as the lowest-prescribing states.
    • Portions of Appalachia and the South have the highest prescription fill rates.
    • Prescription fill rates in rural areas are 16 percent higher than in urban areas.
  • While progress has been made, further improvements surrounding antibiotic prescriptions are warranted. In 2016, healthcare professionals prescribed antibiotics in more than 20 percent of outpatient visits where their use is not indicated to treat the condition.3 Broad-spectrum antibiotics are used in the majority of these cases.

Doctor writing a prescriptionAntibiotic Types

This research looks at four categories of antibiotics across age, gender, geography and setting of care.

Broad-spectrum antibiotics cover a wide range of bacteria and are commonly used when the particular bacteria is unknown. Use of these antibiotics prevents the need to culture bacteria and wait for the results. Because broad-spectrum antibiotics treat a wide range of bacteria, their use is more likely to lead to antibiotic resistance. Examples include azithromycin (including Z-Pak), cefaclor and fluoroquinolones. Broad-spectrum antibiotics are generally recommended to be a backup treatment option or avoided in most common infections.

Intermediate-spectrum antibiotics cover fewer types of bacteria than broad-spectrum antibiotics and are considered the initial recommended treatment for some conditions. Examples include amoxicillin, erythromycin and tetracyclines. Intermediate-spectrum antibiotics are often considered drugs of choice for uncomplicated ear and throat infections caused by several different types of bacteria.

Narrow-spectrum antibiotics are used to treat a narrow range of bacteria and are considered the best initial recommended treatment for specific conditions. Examples include penicillin G and first-generation cephalosporins. Narrow-spectrum antibiotics are typically only effective against bacteria that have not developed resistance, which may include conditions such as uncomplicated skin or urinary tract infections.

Reserved antibiotics are narrow-spectrum, but are not considered the initial recommended treatment for some conditions. Reserved antibiotics should only be used for bacteria that have developed resistance to other antibiotics, such as resistant skin infections caused by MRSA (methicillin-resistant staphylococcus aureus). Examples include vancomycin, linezolid and aztreonam.

Antibiotic Prescription Rates Declining

Antibiotic prescription fill rates in the U.S. have been declining among the commercially insured population since 2010 (see Exhibit 1). There has been a 9 percent decline in fill rates from 2010 to 2016.

Exhibit 1 - Total Antibiotic Prescription Fill Rates (per 100 members)


The steepest decline is in the prescription fill rate of broad-spectrum antibiotics (down 13 percent). These common antibiotics are of greatest concern to public health professionals for their connection to the possible development of antibiotic-resistant bacteria (see Exhibit 2). More modest fill rate declines are also seen in intermediate-spectrum and narrow-spectrum antibiotics.

Exhibit 2 - Antibiotic Fill Rates by the Type of Antibiotic (per 100 Members)

In contrast, reserved antibiotic fill rates grew 30 percent from 2010 to 2016. However, this growth comes from a very small base of only 0.39 prescriptions per 100 members. This type of antibiotic is much less frequently used and serves as the treatment of last resort to fight bacteria that have developed resistance to other antibiotics. This reserved antibiotic fill rate increase may be from higher rates of infection from bacteria with resistance to broader-spectrum antibiotics. The change could also reflect a shift from inpatient to outpatient use of reserved antibiotics in recent years.4

Antibiotic Fill Rates by Age Group and Gender

Antibiotic prescriptions filled for children ages 0 to 17 dropped 16 percent overall from 2010 to 2016 compared to just 6 percent for adults. This decrease suggests that the national push to reduce use of antibiotics in children has had marked success (see Exhibit 3).

For broad-spectrum antibiotic prescription fill rates, there was a decline among all age groups with the steepest decline among children 0 to 12 years of age. Of these children, infants ages 0 to 1 had the sharpest decline in antibiotic fill rates at 22 percent.

Women fill 40 percent more antibiotic prescriptions than men. However, relative declines in prescription fill rates were similar across both groups, 8 percent and 9 percent respectively, between 2010 and 2016.

Exhibit 3 - Antibiotic Fill Rates for Children and Adults (per 100 Members)


Regional Variation in Antibiotic Prescriptions

Antibiotic prescription fill rates vary markedly by state and region. Mississippi, Alabama and Arkansas have the highest prescription fill rates. The fill rates in these three states are nearly three times greater than those in the lowest states of Hawaii, Oregon and Montana (see Appendix A). The states with the highest antibiotic prescription fill rates are grouped in portions of Appalachia and the South (see Exhibit 4). The states with the lowest prescription fill rates are clustered in New England and the West.5 (See Appendix B for additional data by state and Metropolitan Statistical Areas.)

Exhibit 4 - Total Antibiotic Prescription Fill Rate by State in 2016 (per 100 Members)


The antibiotic prescription fill rate is 16 percent higher in rural counties than in urban counties. Broad-spectrum antibiotic fill rates are even higher in rural areas at 19 percent (see Exhibit 5). However, this difference is not nearly as large as the state level differences cited above.

Exhibit 5 - Antibiotic Prescription Fill Rates in Rural and Urban Counties by Type of Antibiotic in 2016 (per 100 Members)


Antibiotic Prescriptions by Setting of Care

Across all sites for outpatient treatment, including office visits, emergency rooms, retail health clinics and online visits, the retail health clinics are least likely to prescribe broad-spectrum antibiotics (see Exhibit 6). Other settings of care were similar in their likelihood to prescribe broad-spectrum (though not intermediate-spectrum or narrow-spectrum) antibiotics.

Exhibit 6 - Type of Antibiotic Prescription Filled by Setting of Care in 2016


Further Improvement Needed for Antibiotic Prescribing

Progress has been made to reduce the use of antibiotics—particularly broad-spectrum antibiotics. Despite the gains, there is opportunity for further improvement in prescribing antibiotics to treat certain conditions.6 In 2016, antibiotics were prescribed for not indicated conditions 21 percent of the time during outpatient visits (see Exhibit 7). Moreover, data show that healthcare professionals are prescribing broad-spectrum antibiotics 75 percent of the time in these situations versus 58 percent of the time when antibiotics are deemed medically appropriate (see Exhibit 8).

Exhibit 7- Antibiotic Prescription Fills by Treatment Indication in 2016 and Exhibit 8 - Type of Antibiotic Prescription Fills by Treatment Indication in 2016


Conclusion

Public health efforts to increase the awareness of excessive antibiotic use and the threat posed by antibiotic-resistant bacteria appear to be achieving measurable results. This report, sponsored by the Blue Cross Blue Shield Association in partnership with HealthCore and Blue Health Intelligence, demonstrates that antibiotic prescriptions filled among commercially insured people in the United States are declining. Moreover, this decline is largely due to the reduction in the fill rate of broad-spectrum antibiotics—the type most likely to contribute to the creation of resistant bacteria. However, the data also show large regional variation in the prescribing of antibiotics and continued high use for conditions where antibiotics have limited effectiveness, indicating there are further improvements to be made.

Methodology Notes

This is the fifteenth study of the Blue Cross Blue Shield: The Health of America Report series, a collaboration between Blue Cross Blue Shield Association and Blue Health Intelligence, which uses a market-leading claims database to uncover key trends and insights into healthcare affordability and access to care. Analysis was performed by and also includes medical claims data from HealthCore, a wholly owned and independently operated health outcomes subsidiary of Anthem, Inc.

The report examines the medical and pharmacy claims of more than 31 million Blue Cross Blue Shield commercially insured members per year (non-Medicare) from 2010 through 2016. This study aims to determine how antibiotic prescription rates have changed during the study period, with breakouts by four different types of antibiotics, age, gender and geography. To measure accuracy of antibiotic prescribing, this study includes a selection of conditions for which antibiotics are denoted “maybe indicated” and “not indicated” as a treatment for a specific condition. All conditions were added together to create each of the two categories of “maybe indicated” and “not indicated,” and the total percentages of these categories were calculated by weighting the number of visits with each condition.

For more information and to read past reports from The Health of America Report Series, visit www.bcbs.com/healthofamerica.

Appendix A

Appendix A


Appendix B

Appendix B


Appendix B (cont.)

Appendix B - Continued


Appendix B (cont.)

Appendix B - Continued


Appendix B (cont.)

Appendix B - Continued


Appendix B (cont.)

Appendix B - Continued


Appendix B (cont.)

Appendix B - Continued


Appendix B (cont.)

Appendix B - Continued

Appendix B (cont.)

Appendix B - Continued


Appendix B (cont.)

Appendix B - Continued


Appendix B (cont.)

Appendix B - Continued


Appendix B (cont.)

Appendix B - Continued


Appendix B (cont.)

Appendix B - Continued


Appendix B (cont.)

Appendix B - Continued


Appendix B (cont.)

Appendix B - Continued


  1. Several professional societies and governing bodies have started and supported antibiotic stewardship programs to promote judicious use of antibiotics. Central to those efforts is the CDC’s Get Smart campaign. Other more recent national campaigns include the Choosing Wisely campaign by the American Board of Internal Medicine Foundation (2012) and the White House’s National Action Plan to Combat Antibiotic-Resistant Bacteria (2015).
  2. The Centers for Disease Control and Prevention (CDC) analyzed outpatient antibiotic prescriptions in 2010 and 2011, around the starting time frame for the data trend in this report, and found that approximately 30 percent of the prescriptions were unnecessary. For more information, see: https://www.cdc.gov/media/releases/2016/p0503-unnecessary-prescriptions.html.
  3. “Not indicated” conditions are common, non-bacterial diagnoses that are generally considered to be inappropriate for antibiotic use and are the focus of antibiotic stewardship programs.
  4. This study only looks at antibiotics prescribed in an outpatient setting, including physician offices, emergency rooms, retail health clinics and online visits.
  5. The variation across states in antibiotic prescription fill rates corresponds to variations in the diagnosis of conditions where the use of antibiotics may be appropriate as well as where they might not be appropriate. This variation in diagnosis could be due in part to local practice patterns, a greater propensity for patients to seek out antibiotics, or true differences in population health.
  6. “Not indicated” conditions are common, non-bacterial diagnoses that are generally considered to be inappropriate for antibiotic use and are the focus of antibiotic stewardship programs to reduce their use. Not-indicated conditions: allergies, asthma, bronchitis–viral, chronic obstructive pulmonary disease (COPD), influenza, serous otitis, viral pneumonia and viral upper respiratory infection. “Maybe indicated” conditions are bacterial infections or conditions where it is unknown if the infectious agent is bacterial and might benefit from antibiotic treatment. Maybe indicated conditions: acne, acute bacterial tonsillitis, bacterial otitis (supprative), bronchitis–bacterial, cellulitis (skin infection), peritonsillar abscess, pneumonia, sinusitis and urinary tract infection.