Early childhood vaccination trends in America

Published January 18, 2018

Executive Summary

Vaccines included in the CDC recommended seven-vaccine series
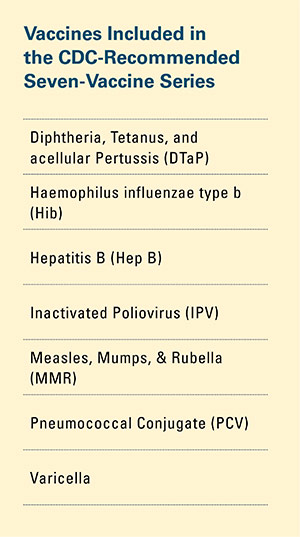
Childhood vaccination is considered one of the top public health accomplishments of the 20th century.1,2 In this new report, the Blue Cross Blue Shield Association, in partnership with HealthCore and Blue Health Intelligence (BHI), examines early childhood vaccination trends for U.S. commercially insured children. The report looks at claims data for children in four birth cohorts (those born in 2010, 2011, 2012 and 2013) and follows their care continuously from birth through 3 years of age.3 This study focuses on completion rates of vaccines in the Centers for Disease Control and Prevention’s recommended seven-vaccine series for children between the years 2013 (by which time the vaccines should have been completed for the first birth cohort) and 2016.4,5,6 (See Appendix A for details on the seven-vaccine series and other CDC-recommended vaccinations and Appendices B and C for specific study methodology.)

This study finds early childhood vaccination rates increased steadily over time. However, wide variation in vaccination rates exists throughout the country at both the state and local levels. Missed well-child visits are a primary driver of under-vaccinated children.

Specific Findings

  • Early childhood vaccination rates continue to improve among commercially insured children in the U.S. Seventy-seven percent of children born in 2013 completed their CDC-recommended seven-vaccine series by 2016, up from 69 percent for children born in 2010 and completing the seven-vaccine series by 2013.
  • The individual rates for each vaccine in this series also increased during this period, with all vaccines reaching 80 percent by 2016. However, despite these improvements, some of these vaccines remain below the CDC and World Health Organization (WHO) optimum levels to ensure herd immunity in the population, including vaccines for diphtheria, pertussis and measles.
  • There is still wide geographic variation in vaccine rates across the country. For example, in 2016, the seven-vaccine series completion rates by state for children in the 2013 birth cohort ranged from a high of 86 percent in North Dakota to a low of 63 percent in Nevada.
  • Vaccine refusals: Documented parental/guardian refusals increased nearly 70 percent for children born in 2013 compared to children born in 2010 (4.2 percent versus 2.5 percent, respectively).
  • Under vaccination: Failure to attend routine well-child visits is the predominant reason identified in the data for under vaccination among commercially insured children. Missed well-child visits were identified as the reason for under vaccination 62 percent of the time among children completing their vaccinations in 2016. Among these same under-vaccinated children, documented parental/guardian refusal was identified 6 percent of the time.
In 2016, 77% of commercially insured children born in 2013 completed CDC recommended seven-vaccine series


Early Childhood Vaccination Trends

Exhibit 1: Percentage of children completing the CDC recommended seven-vaccine series by birth yearThe proportion of children up-to-date on the CDC-recommended seven-vaccine series by 27 months of age rose steadily in recent years (see Exhibit 1). Completion rates have increased 12 percent nationally from 69 percent for children born in 2010 (who completed the series by 2013) to 77 percent for children born in 2013 (who completed the series by 2016).

Completion rates for each of the seven individual vaccine regimens increased for children born in 2013 when compared to children born in 2010, with each vaccine now exceeding 80 percent (see Exhibit 2).

Despite these improvements, some vaccines remain below the CDC and WHO recommended levels to ensure herd immunity in the population.7 For example, diphtheria may need vaccination rates as high as 86 percent, and pertussis and measles as high as 94 percent, to ensure herd immunity. The vaccine rates (DTaP and MMR) for these diseases are currently 83 percent and 91 percent nationally, respectively. (See Appendix D.)

Exhibit 2: Percentage of children completing individual vaccine regimens


Geographic Variation of Early Childhood Vaccinations

Wide geographic variation exists for completion rates of the CDC-recommended seven-vaccine series when comparing these rates by state, metropolitan statistical areas (MSAs) and counties. (See Appendix E.)

State-level completion rates for children born in 2013 (based on data collected through 2016) ranged from a high of 86 percent in North Dakota to a low of 63 percent in Nevada (see Exhibit 3).8

Exhibit 3: Percentage of children completing the CDC-recommended seven-vaccine series by state for children born in 2013 (and completing vaccines by 2016)


Rates of Vaccine Refusals
Among all children, the proportion with one or more documented parental/guardian vaccine refusal increased from 2.5 percent for children born in 2010 to 4.2 percent for children born in 2013 (see Appendix E). Refusals for the 2013 birth cohort are spread fairly evenly across all of the seven vaccines in the CDC-recommended series. This spread suggests that no single vaccine is more likely to result in a refusal than any other vaccine (see Exhibit 4).9

Exhibit 4: Percentage of children completing each of the vaccinations in the CDC-recommended seven-vaccine series by 27 months of age - a ll birth cohorts

Documented parental/guardian vaccine refusal rates also vary by state and MSA (see Appendix E). Higher rates of refusal are found in the Northeast—particularly the New York City area—and in the Pacific Northwest, while lower rates are found in the South and Midwest.

Reasons for Under-Vaccinated Children by Age 27 Months
Overall, early childhood vaccination rates are strong nationwide and increasing in recent years, yet there remains opportunity for improvement in many areas. Reasons identified in the data for under vaccination in children (those who fail to complete their seven-vaccine series by age 27 months) are presented in Exhibit 5.10

Among children scheduled to complete their vaccinations by 2016, 23 percent missed one or more of the vaccines in the CDC-recommended seven-vaccine series. Missed well-child visits accounted for 62 percent of all of these under-vaccinated children (see Exhibit 5). In contrast, documented vaccine refusals accounted for 6 percent of these under-vaccinated children. Delays due to scheduling vaccinations where children eventually completed the seven-vaccine series (called inferred delays) accounted for 4 percent of these under-vaccinated children.

Exhibit 5: Reasons for under vaccination for children scheduled to complete the CDC-recommended seven-vaccine series by 2016


In general, children who have attended more well-child visits have higher vaccine completion rates. On average, sufficiently vaccinated children completing the seven-vaccine series by 27 months of age had two more well-child visits than children who did not complete the series.11

For the 6 percent of under-vaccinated children where a parental/guardian vaccine refusal was the reason for under vaccination, 29 percent of refusals took place on the first day of life (see Exhibit 6). An additional 15 percent of refusals took place before reaching 4 months of age. Parental/guardian vaccine refusals decrease rapidly as children grow older.

Exhibit 6: Percentage of parent/guardian documented refusals by age of the child when the refusal occurred - all birth cohorts


Conclusion

This report, sponsored by the Blue Cross Blue Shield Association, in partnership with HealthCore and Blue Health Intelligence, demonstrates that early childhood vaccination rates are on the rise nationwide but there is room for further improvement. While the national rate of fully vaccinated children grew, there is still significant geographic variation. Missed well-child visits appear to be the largest reason for under-vaccination among children from birth to age 2 years 3 months. This study suggests continued awareness, education and compliance with the recommended well-child visits could improve vaccination rates. Administration of the seven-vaccine series will sustain improvements in vaccination rates of children in America.


Appendix

Appendix A: CDC-Recommended Vaccinations by Age Group

CDC-Recommended Vaccines for Children by Age 18 months

CDC-Recommended Vaccines for Children by Age 18 months


This report focuses on the seven-vaccine series as the definitive CDC summary measure of childhood vaccinations. The CDC also recommends two vaccinations for Hepatitis A, two or three for rotavirus (depending on the manufacturer of the vaccine), and the seasonal flu shot to be given by age 18 months (24 months in the case of the Hepatitis A vaccine)

For more information, see: https://www.cdc.gov/mmwr/volumes/65/wr/pdfs/mm6539a4.pdf

Appendix B: Methodology

Data and Study Population

This is the seventeenth study of the Blue Cross Blue Shield: The Health of America Report series, a collaboration between the Blue Cross Blue Shield Association and Blue Health Intelligence, which uses a market-leading claims database to uncover key trends and insights into healthcare affordability and access to care. Analysis was performed by and also includes medical claims data from HealthCore, a wholly owned and independently operated health outcomes subsidiary of Anthem, Inc.

This study looks at medical claims for services taking place between January 1, 2010 through December 31, 2016. Children with three years of continuous medical eligibility in a commercial BCBS plan were included in the study as summarized below:

Birth cohorts under study

Total sample size (the number of children contributing data to the childhood vaccination rates) was 843,610 children.

For the children in this study, each birth cohort is labeled by the year in which the child is born, followed by data for three years for each cohort. As a result, for children born in 2010, data from 2010, 2011, 2012 and 2013 are included; for children born in 2011, data from 2011, 2012, 2013 and 2014 are included, and so on for the next two birth years.

Children are counted as fully immunized with the series or individual vaccines as long as they receive the needed vaccine(s) by age 27 months, allowing nine months of buffer time for parents/guardians running behind schedule to take their children to their physician to receive their vaccines.

The report does not capture members who will receive the childhood vaccines after 27 months of age or members who received vaccines from a free public or private local program that does not generate a medical claim.

For more information and to read past reports from The Health of America Report series, visit www.bcbs.com/the-health-of-america.

Methodological Notes

  • The analysis included all medical claims for vaccine utilization.
  • Metrics were adjusted for presence of “administration-only” vaccination claims.
  • States, metropolitan statistical areas and counties with less than 500 children in a given sample were excluded from display.

Under Vaccination Rationale Hierarchy
A reason for under vaccination was assigned for each insufficiently vaccinated case based on information
available in the claims data and following the order indicated below. When more than one reason is identified
for a given child, the highest ranked item below was taken as the reason for under vaccination:

  1. Child had a contraindication for vaccination, for example HIV.
  2. Child’s parent/guardian refused at least one vaccine as identifiable by diagnosis code.
  3. Child had the disease the vaccine is meant to prevent.
    1. For example: A diagnosis code for varicella (chicken pox) would be a “reason” for non-compliance with the varicella vaccine.
    2. Presence of disease was assessed from birth to age 2 years and 3 months.
  4. Child missed at least two well-child visits to a physician.
    1. Number of well-child visits up to age 2 years and 3 months was less than nine visits. (AAP recommends 10 well-child visits by this age.)
  5. Inferred delay
    1. Child was not up-to-date as of age 2 years and 3 months but was up-to-date as of age 3 years.
  6. Unknown reason

Data Exclusion
Data from Anthem BCBS were excluded from California because of the prevalence of capitated payments to primary care providers, reducing the incentive for providers to submit claims for primary care, and under representing vaccination rates in that state. Additionally, in several cases, insufficient sample sizes resulted in the exclusion of certain states or metropolitan statistical areas from the reporting of results. Sample size minimums exclude the reporting of results from Alaska, Hawaii, Montana, South Dakota, Washington D.C. and Wyoming and select metropolitan areas.

Appendix C: Comparison with HEDIS Childhood Immunization Status Methodology

The vaccination rates in the report use different data sources and different methodology and have no direct connection to the HEDIS measurements published by individual health plans. HEDIS measures rely on multiple sources including medical records and state immunization data, whereas this report relies on claims data to ensure consistency across all areas of the country. Moreover, HEDIS measures are health plan or product-specific, while the measures in this report look at the entire BCBS commercially insured population and are reported based on the child’s state of residence. See below for a detailed comparison with HEDIS measures. The report also does not capture vaccinations that may be administered without a medical claim through public health departments and local programs.

Appendix C: Comparison with HEDIS Childhood Immunization Status Methodology

Sources for HEDIS measure details:


Appendix D: Vaccination Rates for CDC-Recommended Vaccines

National Childhood Vaccination Rates for CDC-Recommend Vaccines by Birth Year for Children Age 18 Months or Younger (Measured at 2 years and 3 months)

Appendix D: Vaccination Rates for CDC-Recommended Vaccines


Appendix E-1: Seven-vaccine Series Vaccination Rates by State

Appendix E-1: Seven-vaccine Series Vaccination Rates by State


Appendix E-2: Seven-vaccine Series Vaccination Rates by MSA

Appendix E-2: Seven-vaccine Series Vaccination Rates by MSA


Appendix E-2: Seven-vaccine Series Vaccination Rates by MSA


Appendix E-2: Seven-vaccine Series Vaccination Rates by MSA


Appendix E-2: Seven-vaccine Series Vaccination Rates by MSA


Appendix E-2: Seven-vaccine Series Vaccination Rates by MSA


Appendix E-3: Seven-vaccine Series Vaccination Rates by County

Appendix E-3: Seven-vaccine Series Vaccination Rates by County


Appendix E-3: Seven-vaccine Series Vaccination Rates by County


Appendix E-3: Seven-vaccine Series Vaccination Rates by County


Appendix E-3: Seven-vaccine Series Vaccination Rates by County


Appendix E-3: Seven-vaccine Series Vaccination Rates by County


Appendix E-3: Seven-vaccine Series Vaccination Rates by County


Appendix E-3: Seven-vaccine Series Vaccination Rates by County


Appendix E-3: Seven-vaccine Series Vaccination Rates by County

Appendix E-4: Vaccination Rates by Vaccine and State

Appendix E-4: Vaccination Rates by Vaccine and State


Appendix E-4: Vaccination Rates by Vaccine and State


Appendix E-5: Vaccination Rates by Vaccine and MSA

Appendix E-5: Vaccination Rates by Vaccine and MSA


Appendix E-5: Vaccination Rates by Vaccine and MSA


Appendix E-5: Vaccination Rates by Vaccine and MSA


Appendix E-5: Vaccination Rates by Vaccine and MSA


Appendix E-5: Vaccination Rates by Vaccine and MSA


Appendix E-6: Vaccination Rates by Vaccine and County

Appendix E-6: Vaccination Rates by Vaccine and County


Appendix E-6: Vaccination Rates by Vaccine and County


 Appendix E-6: Vaccination Rates by Vaccine and County


 Appendix E-6: Vaccination Rates by Vaccine and County


 Appendix E-6: Vaccination Rates by Vaccine and County


 Appendix E-6: Vaccination Rates by Vaccine and County


 Appendix E-6: Vaccination Rates by Vaccine and County


 Appendix E-6: Vaccination Rates by Vaccine and County


Appendix E-7: Rate of Vaccine Refusal by State+

Appendix E-7: Rate of Vaccine Refusal by State


Appendix E-8: Rate of Vaccine Refusal by MSA

Appendix E-8: Rate of Vaccine Refusal by MSA


Appendix E-8: Rate of Vaccine Refusal by MSA


Appendix E-8: Rate of Vaccine Refusal by MSA


Appendix E-9: Rate of Vaccine Refusal by County

Appendix E-9: Rate of Vaccine Refusal by County


Appendix E-9: Rate of Vaccine Refusal by County


Appendix E-9: Rate of Vaccine Refusal by County


Appendix E-9: Rate of Vaccine Refusal by County


  1. For more information, see: https://www.healthypeople.gov/2020/topics-objectives/topic/immunization-and-infectious-diseases
  2. In recent years, emphasis has been placed on the lack of vaccination during unexpected outbreaks of preventable health conditions. For example, at least 569 people have been infected and 17 have died from the Hepatitis A virus since November in San Diego, Santa Cruz and Los Angeles counties. (Form more information, see: http://www.latimes.com/local/California/la-me-ln-hepatitis-outbreaks-20171006-htmlstory.html) In addition, 79 cases of measles were reported in Minnesota between January and May 2017, exceeding the total number of measles cases among the entire U.S. population in 2016. (For more information, see: https://www.cdc.gov/measles/cases-outbreaks.html)
  3. While claims data are a useful vehicle for consistent comparisons of vaccination rates across geographies and over time among commercially insured Americans, they do not capture vaccinations obtained from sources where an insurance claim is not filed. One way to supplement claims derived vaccination rates is to leverage state vaccination registries. In fact, a number of insurers use these registries to refine the vaccination rate estimates that they report publically for HEDIS and other purposes. However, to incorporate registry information systematically into a national trend report such as this one would require that payers in all states have access to them. This is currently not the case. For a comparison of the differences in the underlying methodology used in this report and those used in HEDIS measurement of vaccination rates, see Appendix C.
  4. Although the CDC recommends that these vaccines should be completed before 18 months of age, this report looks at whether a child has completed these recommended vaccinations by 27 months, or age 2 years and 3 months.
  5. The CDC estimates that for each U.S. birth cohort that receives the recommended childhood immunizations, about 20 million illnesses and more than 40,000 deaths are prevented, resulting in 70 billion dollars in financial savings. Despite this achievement, many measures indicate that vaccination rates in the U.S. remain below national public health goals, such as the 90 to 95 percent vaccination rates needed to achieve herd immunity for certain diseases. For more information, see: https://www.ncbi.nlm.nih.gov/pmc/articles/PMC4927017/
  6. While the CDC’s seven-series vaccine was chosen as a summary measure, the methodology for calculating vaccine rates in this report differs substantially from the methodology used by the CDC. The methodology in this report uses claims data as its source while the CDC uses a survey with follow-up chart review. This report also looks at commercially insured children by birth cohort while the CDC looks at a sample of all children 19 to 35 months of age in a calendar year. These differences sometimes lead to differences in estimated rates, particularly for specific geographies. Despite differences in approach, national estimates of the seven-series rates are very similar to the CDC numbers with estimates differing less than two percentage points for the years 2013 through 2015.
  7. The CDC defines herd immunity as: “A situation in which a sufficient proportion of a population is immune to an infectious disease (through vaccination and/or prior illness) to make its spread from person to person unlikely. Even individuals not vaccinated (such as newborns and those with chronic illnesses) are offered some protection because the disease has little opportunity to spread within the community.” For more information, see: https://www.cdc.gov/vaccines/terms/glossary.html#c; http://sitn.hms.harvard.edu/wp-content/uploads/2010/09/Lecture_1.2.pdf; and https://academic.oup.com/cid/article/52/7/911/299077.
  8. Alaska, Hawaii, Montana, South Dakota, Washington, D.C. and Wyoming were excluded from reporting due to an insufficient study population.
  9. Documented refusal rates are based on all ten CDC-recommended vaccines for early childhood. Forty percent of children with a documented parental/guardian vaccine refusal caught up on all of the CDC-recommended vaccines in the seven-vaccine series by their 27th month of age, suggesting that some initial refusals are not based on a sustained objection to vaccinations.
  10. Under-vaccinated children as defined here should not be confused with children with a “documented parental/guardian refusal” as defined in the previous section. Children in the former group do not complete their seven vaccine series by age 27 months. Forty percent of children in the latter group with a documented parental/guardian refusal eventually do complete the vaccine series despite the initial refusal.
  11. The American Academy of Pediatrics (AAP) recommends 10 well child visits by age 2.

+ Documented refusal rates are based on all ten CDC-recommended vaccines for early childhood.