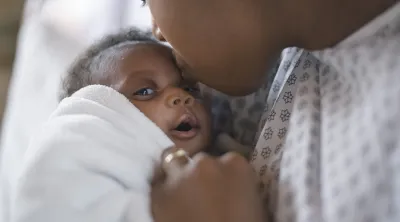
Pregnant women in the United States are more than twice as likely to die from complications related to pregnancy or childbirth than those in most other high-income countries in the world.1 Rates of severe maternal morbidity (SMM) have been increasing among all women. But behind these statistics lie racial disparities in SMM rates and their risk factors, such as bleeding disorder, diabetes and heart disease.
This study examines variations in many of these SMM rates, as well as the most common risk factors for those events, between white, Black and Hispanic communities. We include hospital births covered by Blue Cross and Blue Shield commercial insurance from January 2018 to October 2020.
Women in majority Black communities have a 63% higher rate of SMM than women in majority white communities. Women in majority Hispanic communities have a 32% higher rate of SMM than women in majority white communities. These rates are higher across all age groups and nearly all indicators examined. This analysis also shows that Black and Hispanic women have a substantially higher prevalence than white women of the most common risk factors that put women at risk of SMM.
Blue Cross and Blue Shield companies have committed to reducing racial disparities in maternal health by 50% in five years. A detailed analysis of the racial disparities in SMM as well as the risk factors for those events can help us target interventions so desperately needed to narrow these disparities and improve maternal health for all women.
Related Content: A September 2022 BCBS report examined the latest trends in SMM, finding continuing racial and ethnic maternal health disparities. The report found that SMM rates are consistently higher among Black, Latina and Asian women compared to White women, regardless of age or type of insurance.
1. WIDE DISPARITIES IN CHILDBIRTH COMPLICATIONS
SMM rates were substantially higher for women in majority Black and majority Hispanic communities (63% and 32% respectively) than for women in majority white communities in 2020.
Since 2018, rates are on the rise overall, with Hispanic women seeing the highest increase of 19%. Although Black women saw a modest decrease in 2020, they have much higher SMM rates compared to women in majority white and Hispanic communities.
2. YOUNGER BLACK MOTHERS ARE STILL AT HIGHER RISK
Overall, women ages 35-44 had higher rates of SMM than those under age 35. However, women in majority Black communities under the age of 35 had SMM rates higher than women in majority white communities ages 35-44.
3. DISPARITIES VARY IN SMM INDICATORS BETWEEN RACES/ ETHNICITIES
Compared to majority white communities, women in majority Black and Hispanic communities have higher prevalence rates for nearly all SMM indicators examined such as kidney failure, sepsis, shock and eclampsia.
4. BLACK AND HISPANIC WOMEN ARE MORE LIKELY TO HAVE RISK FACTORS FOR SMM
Women in majority Black communities have up to twice the prevalence of risk factors, such as hypertension or anemia, for SMM than women in majority white communities.
Women in majority Hispanic communities have prevalence rates up to a third higher for some risk factors, such as prior cesarean birth and pre-existing diabetes, than women in majority white communities.
What Is SMM?
Severe Maternal Morbidity, or SMM, measures unexpected outcomes from labor and delivery with significant short- or long-term consequences to a woman’s health.2 The Centers for Disease Control and Prevention categorizes SMM by 21 different adverse events, known as “indicators”.3 In some cases, an SMM indicator can be associated with maternal death.

SMM RATES OVERALL ARE HIGHER FOR BLACK AND HISPANIC WOMEN
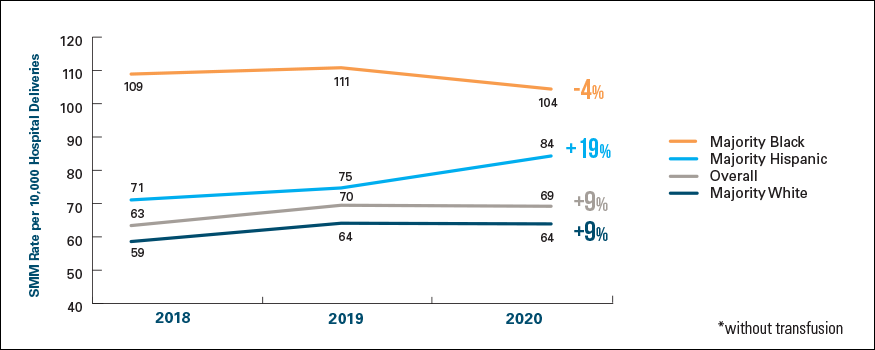
The overall SMM rate (excluding blood transfusions4) rose by 9% for all women between 2018 and 2020, from 63.4 per 10,000 hospital deliveries in 2018 to 69.2 per 10,000 in 2020, and major racial/ethnic disparities persist. The SMM rate in majority Black communities was 63% higher in 2020 than in majority white communities.
The rate declined moderately by 4% between 2018 and 2020, but is still much higher than seen in majority Hispanic and white communities. The SMM rate in majority Hispanic communities was 32% higher in 2020 than in majority white communities, having risen 19% between 2018 and 2020 (see Exhibit 1).
Exhibit 1: SMM Rate* by Community Race/Ethnicity, 2018-2020
SMM DISPARITIES ARE MORE PRONOUNCED FOR BLACK AND HISPANIC WOMEN ACROSS ALL AGE GROUPS
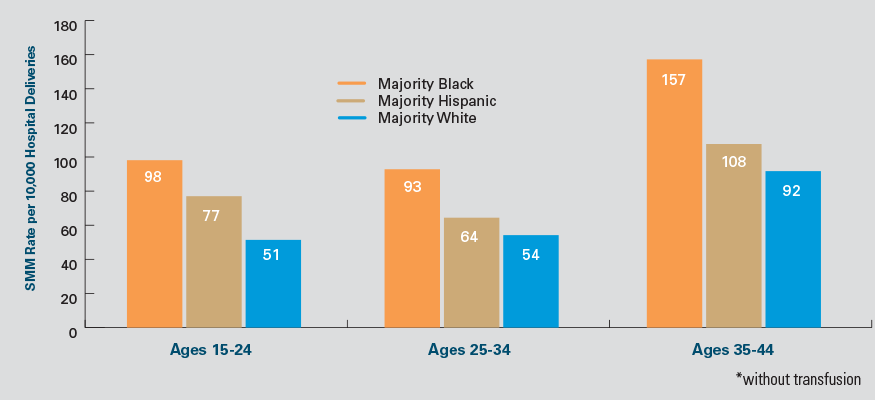
Across all communities, younger (ages 15-24) and older (ages 35-44) pregnant women were more likely to have higher SMM rates compared to women ages 25-34. Across all age groups, women in majority Black and Hispanic communities were more likely to have higher SMM rates compared to women in majority white communities.
Racial disparities in SMM are even more pronounced for women in majority Black communities. The SMM rate for women younger than 35 in majority Black communities is still higher than the SMM rate for women 35 and older (and, therefore, considered higher risk) women in majority white communities (see Exhibit 2).
Exhibit 2: SMM Rate* by Community Race/Ethnicity and Age Group, 2018-2020 Combined
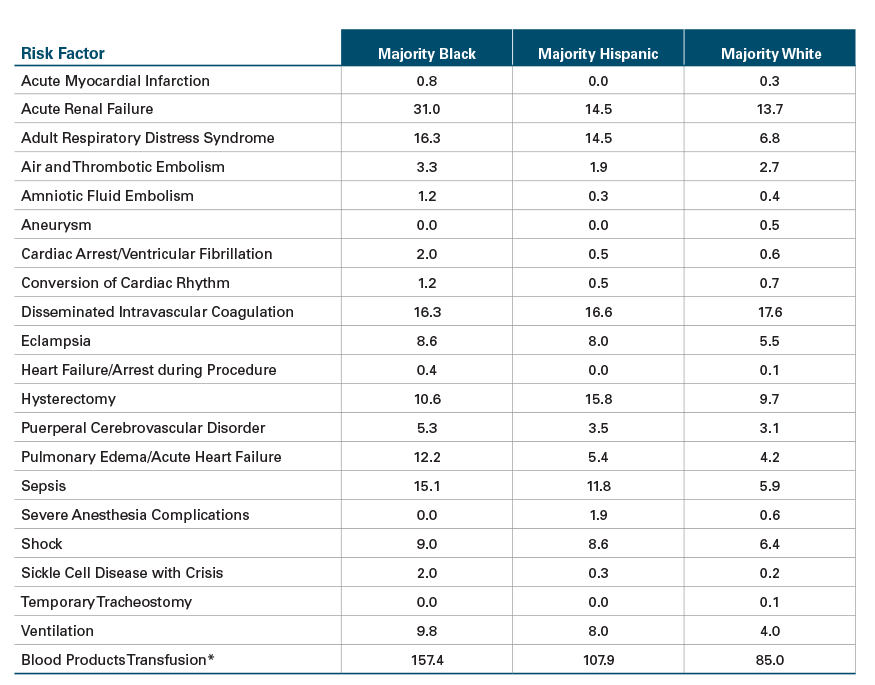
RATES FOR INDIVIDUAL SMM INDICATORS BY RACE/ETHNICITY SHOW WIDE DIFFERENTIALS
Among women in majority Black communities, acute renal failure was the most common SMM indicator. Rates of pulmonary edema/acute heart failure showed the widest racial disparity, being nearly three times as prevalent among women in majority Black versus majority white communities.
Among women in majority Hispanic communities, hysterectomy was the most common SMM indicator. Rates of adult respiratory distress syndrome showed the widest racial/ethnic disparity, being more than twice as high as women in majority Hispanic versus majority white communities (see Exhibit 3).
Exhibit 3: Prevalence Rate (per 10,000) and Differentials between Majority Black, Majority Hispanic and Majority White Communities for the Most Common SMM Indicators, 2020*
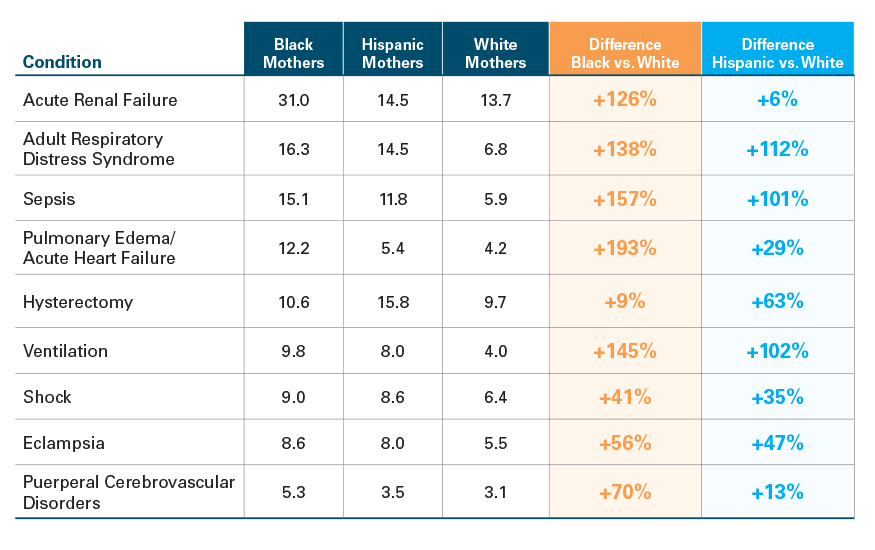
*Only indicators showing a disparity across communities are shown.
RATE OF RISK FACTORS5 FOR SMM VARY BY RACE/ETHNICITY
Certain factors, such as hypertension and anemia, raise a woman’s risk for SMM events. Major racial/ethnic disparities exist for these factors, as well. To quantify the risk, we calculated a risk ratio, meaning a measure of how much more likely an SMM indicator occurs among those with a particular risk factor versus those without. For example, women with preexisting diabetes are three times as likely to have an SMM indicator as women without.
Exhibit 4: Common Factors with the Highest Risk Ratios for SMM for Women Overall6
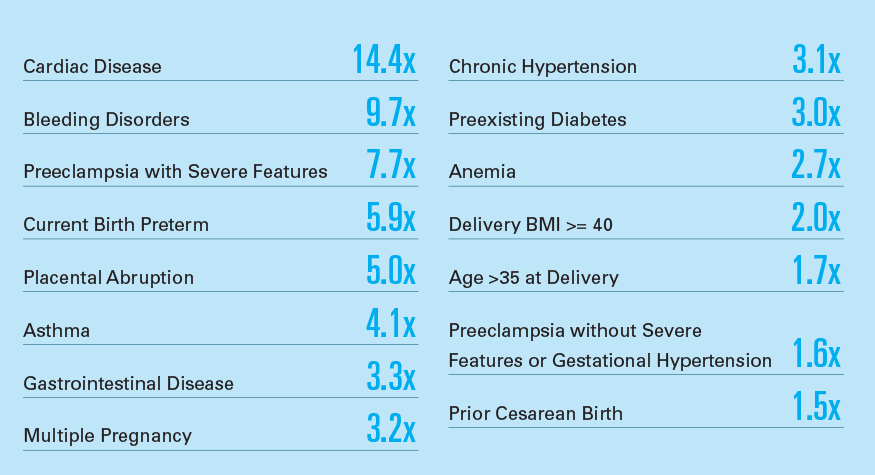
Among the most common risk factors (those occurring in at least 1 in 200 deliveries), cardiac disease, bleeding disorders and preeclampsia with severe features had the highest risk ratios for SMM.

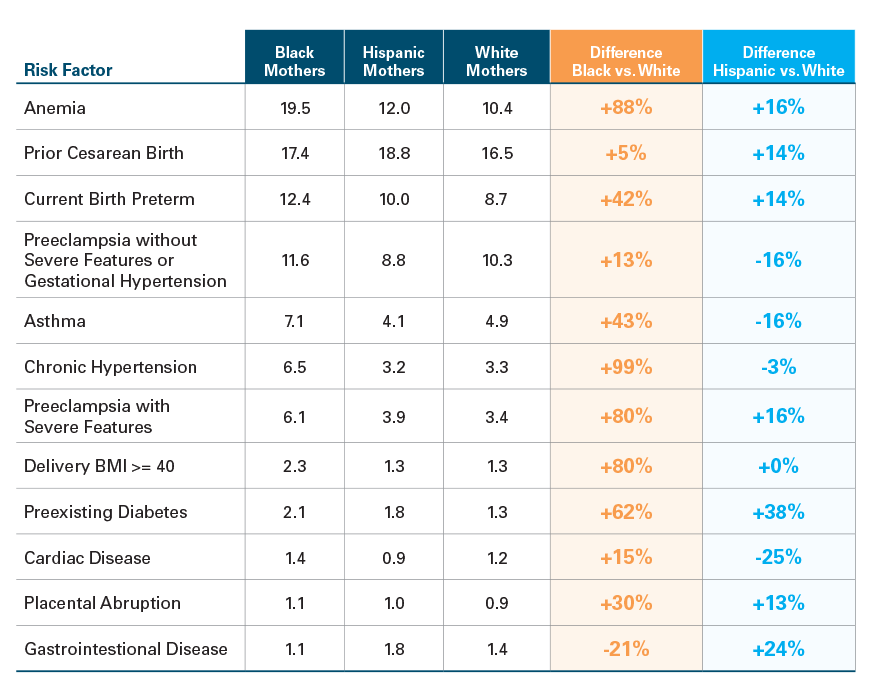
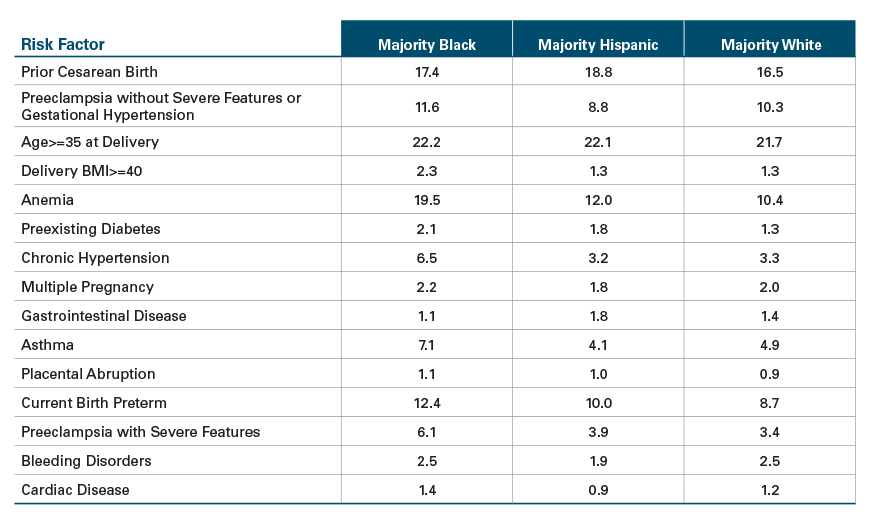
Across multiple chronic conditions such as anemia, hypertension, high body mass index and preeclampsia with severe features, women in majority Black communities had prevalence rates nearly twice those of women in majority white communities. Anemia was the most common risk factor for women in majority Black communities, with more than one in five experiencing this condition, compared to one in 10 women in majority white communities (see Exhibit 5).
Preexisting diabetes was 38% more common among women in majority Hispanic than majority white communities. Women in these Hispanic communities also had marginally higher rates for a number of other risk factors including gastrointestinal disease, preeclampsia and anemia (see Exhibit 5).
Exhibit 5: Prevalence Rates (Per 100) and Differentials between Majority Black, Majority Hispanic and Majority White Communities for Common Risk Factors, 2018-2020
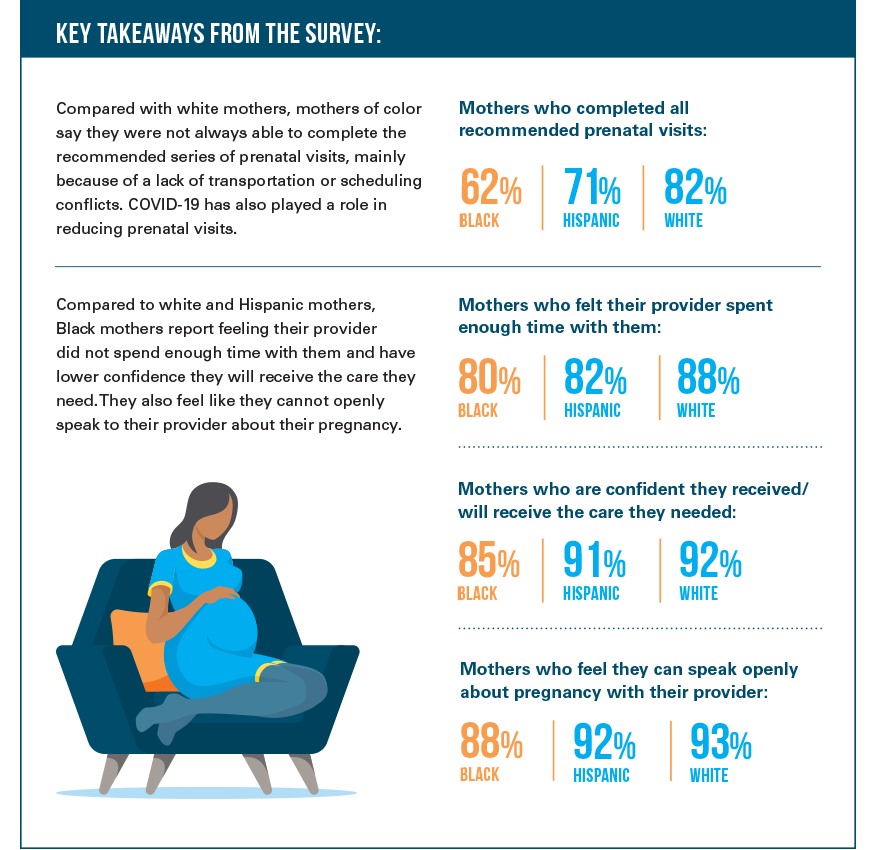
SURVEY: WHAT BLACK, HISPANIC AND WHITE WOMEN SAY ABOUT THEIR PREGNANCY AND CHILDBIRTH CARE7
The type and quality of care a woman receives while pregnant, during childbirth and after giving birth can impact a woman’s likelihood of experiencing SMM. The racial disparities in SMM rates and the risk factors for SMM suggest that women of color may experience pregnancy and childbirth care much differently than white women.
To learn more about these experiences, we conducted a survey in April 2021 of 751 women between the ages of 18 to 40 who were pregnant or had a biological child under the age of one. The survey results show that, compared to white women, Black and Hispanic women may not be receiving the kind of care necessary to manage their risks for SMM.
A CALL TO ACTION
Health disparities are the result of a complex fabric of social, racial and economic injustice—a fabric we can’t unravel overnight. But Blue Cross and Blue Shield companies are taking immediate and ongoing action to put an end to these inequities. Our first focus is on racial disparities in maternal health. As this report shows, these disparities are wide across all age groups, for SMM rates as well as the risk factors for those events. Many BCBS companies have started the work to reduce these disparities and prevent dangerous and tragic outcomes. That includes identifying women at risk and providing one-on-one coaching to manage their chronic conditions during pregnancy, addressing underlying social needs that have a significant impact on health and providing community support, such as doulas, to mothers throughout their pre- and postnatal journeys. We welcome public health experts, policymakers, community advocates, providers, industry leaders, employers and others to join us in this fight for health equity.
Please learn more about our efforts at bluehealthequity.com.
END NOTES
- “Maternal mortality and maternity care in the United States compared to 10 other developed countries,” The Commonwealth Fund, Issue Brief, November 18, 2020
- American College of Obstetricians and Gynecologists and the Society for Maternal–Fetal Medicine, Kilpatrick SK, Ecker JL. Severe maternal morbidity: screening and review. Am J Obstet Gynecol. 2016;215(3):B17–B22.
- Severe maternal morbidity in the United States, Centers for Disease Control and Prevention
- We exclude blood transfusions from our SMM analyses which aligns with several public reports of SMM (citations below). In addition, hospital discharge data does not include quantity of blood units used, which may be an important determinant of whether blood transfusion is associated with severe morbidity in the absence of other SMM indicators. (Department of Health & Human Services – Healthy Women, Healthy Pregnancies Healthy Futures: Action Plan to Improve Maternal Health in America and Healthy People 2030 Reduce severe maternal complications identified during delivery hospitalizations — MICH‑05).
- Risk factors as defined by the California Maternal Quality Care Collaborative.
- Risk factors with a prevalence rate higher than 0.5 per 100 among pregnant women.
- Online national survey (N=751) conducted in April of 2021 among white, Hispanic and Black women 18-40 years of age, who were pregnant or had a biological child 0-11 months old. Sample included respondents with commercial and public health insurance coverage as well as uninsured.
- Wisconsin Medical Journal 114no5
- https://www.cmqcc.org/research/severe-maternal-morbidity/obstetric-comorbidity-scoring-system
METHODOLOGY
This is the 35th study of the Blue Cross Blue Shield, The Health of America Report® series, a collaboration between Blue Cross Blue Shield Association and Blue Health Intelligence (BHI), which uses a market-leading claims database to uncover key trends and insights in healthcare affordability and access to care.
HOW WE CONDUCTED THIS STUDY:
Severe Maternal Morbidity (SMM) was estimated using the Centers for Disease Control and Prevention’s 21 defined indicators.3 The indicators were identified using claims from 2.2 million hospital deliveries occurring from January 1, 2018 to October 31st, 2020. Blood transfusion was excluded from the report since many blood transfusions are not truly indicative of SMM, but often less severe in nature.8 The rate of SMM includes the rate of SMM indicators present per 10,000 delivery hospitalizations. A woman can experience more than one SMM during a delivery hospitalization.
Risk factors for SMM were identified using the California Maternal Quality Care Collaborative’s (CMQCC) risk adjustment system.9 These risk factors were identified as present on admission through BCBS claims data. Risk ratio is an estimate of the SMM rate for women with the risk factor present on admission divided by the SMM rate for women without the risk factor present on admission.
Race/ethnicity is determined by ZIP code when more than 50% of the households identify as either Black, Hispanic or white. This ZIP code data is from the 2017 American Community Survey (ACS). The estimated number of pregnancies occurring in each community category are: white 612,000; Black 30,000; and Hispanic 46,000.
APPENDIX
Prevalence Rate (per 10,000) of 21 SMM Indicators by Community Race/Ethnicity, 2020
Prevalence Rate (per 100) of Most Common Risk Factors by Community Race/Ethnicity, 2018 – 2020 Combined
Risk Ratios of Most Common Risk Factors for SMM by Community Race/Ethnicity, 2018 – 2020 Combined
