Trend Update: Generic and Branded Drugs
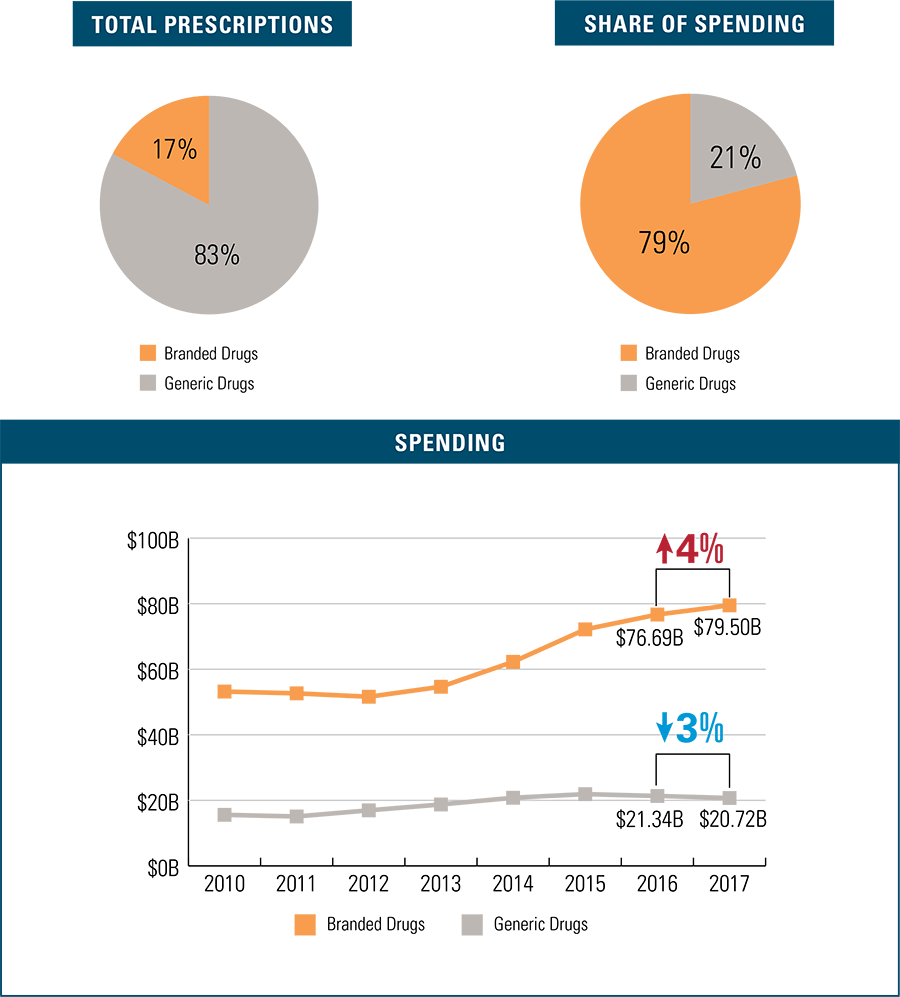
Generic drugs outpace branded drugs in terms of prescriptions filled at 83 percent, and total spending on generic drugs has declined 3 percent since 2016. In marked contrast, branded prescription drug spending is up 4 percent since 2016. Branded prescription drugs comprise only 17 percent of total prescriptions filled but dominate overall drug spending at 79 percent.
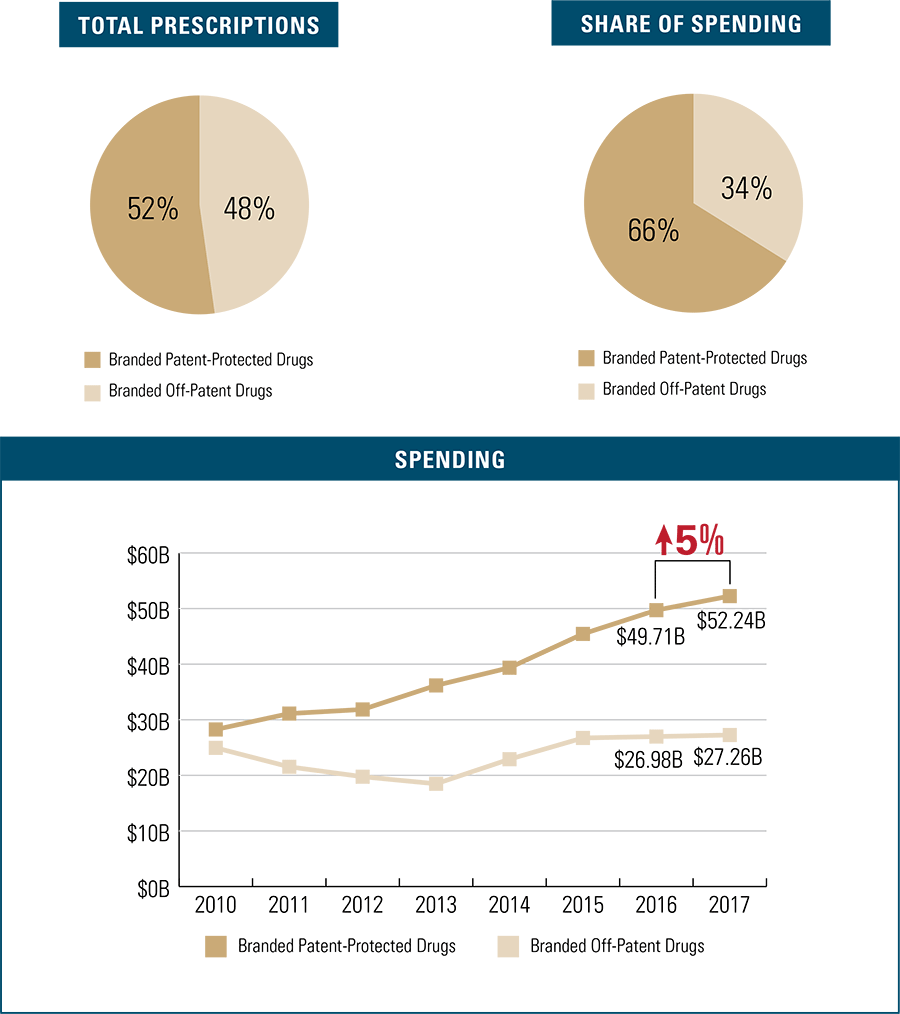
Branded Drugs: A Closer Look at $79.5 Billion in Spending
Branded Patent-Protected Drug Trends
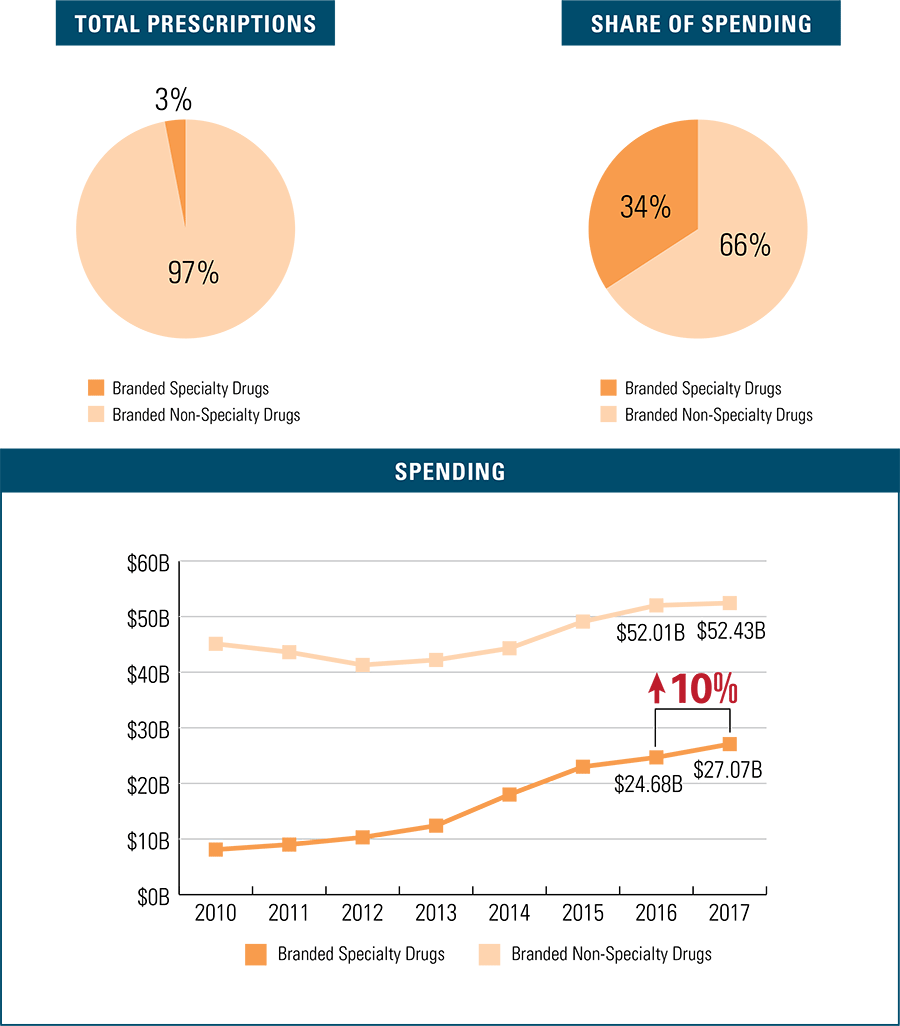
Steady annual increases in branded patent-protected prescription costs drive the majority of spending in the branded drug space, growing 5 percent in the past year alone. Branded patent-protected prescription drugs make up 52 percent of branded prescription drugs filled, but account for 66 percent of total branded drug spending.
Branded Specialty Drug Trends
Branded specialty drugs make up a small share of branded prescription drugs filled at 3 percent, but account for 34 percent of branded drug spending in 2017. This is the fastest growing branded drug type in terms of spending—rising 10 percent in just the past year.
Top 30 Medications in 2017
The top 30 medications list includes both branded and generic drug types. Yet 22 of the 30 medications are costly branded specialty drugs, many of which are also patent-protected. Without competitive alternatives to expensive branded drugs, their costs are likely to drive annual upticks in overall drug spending.
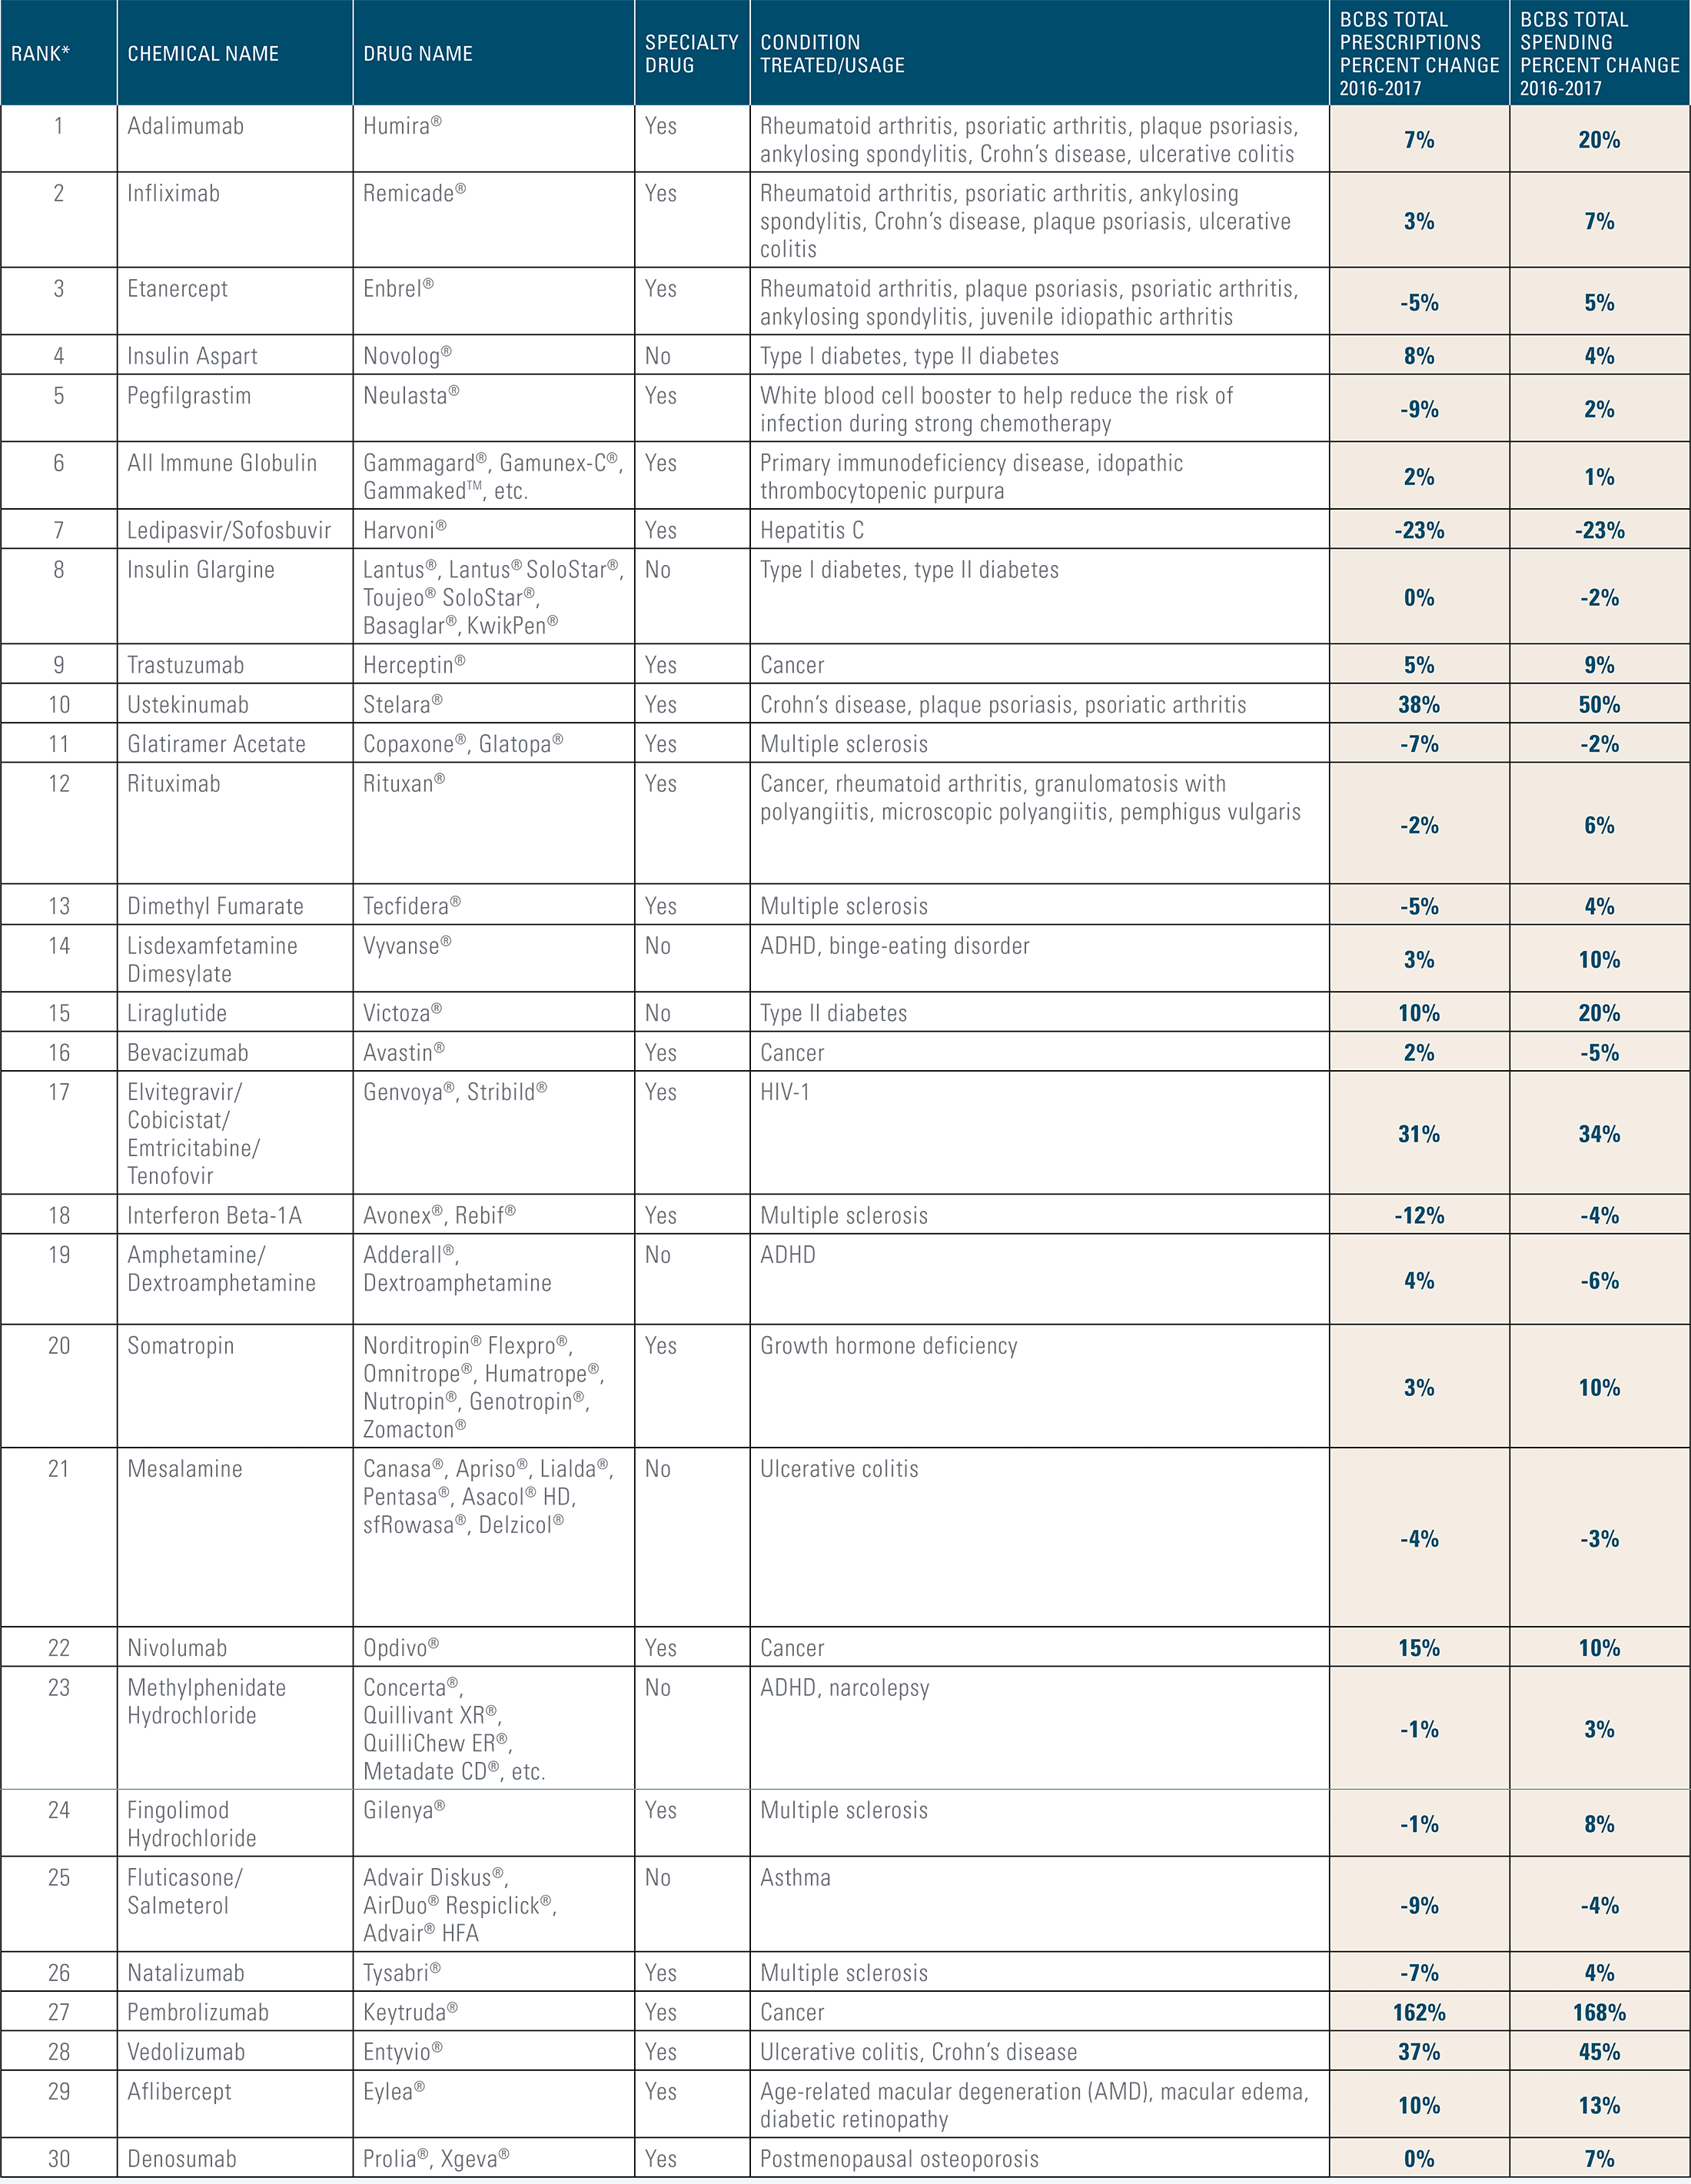
* Medications in this list were ranked by total BCBS drug spending in 2017, listed in order from highest amount spent to lowest amount spent.
Methodology
This is the 22nd study of the Blue Cross Blue Shield, The Health of America Report® series, a collaboration between Blue Cross Blue Shield Association and Blue Health Intelligence (BHI), which uses a market-leading claims database to uncover key trends and insights in healthcare affordability and access to care.
This report is based on the claims of more than 40 million BCBS commercially insured members (under age 65) each year from 2010 to 2017 that are available in the Blue Cross Blue Shield Axis® database.
Pharmacy claims were used to estimate total spending and utilization. Prescriptions were defined equally regardless of their dosage and up to a duration of 30 days. Prescriptions greater than 30 days were broken out into 30-day increments.
The findings in this report do not include the impact of drug rebates. Drug rebates are given at the level of negotiated contracts, not at the level of prescription drug claims, and vary by a number of factors (e.g., market segment, pharmacy benefits manager, manufacturer, insurer, etc.).
Total spending and utilization results were extrapolated to the entire 88 million BCBS commercially insured population in 2017 and are adjusted for year-over-year membership growth.
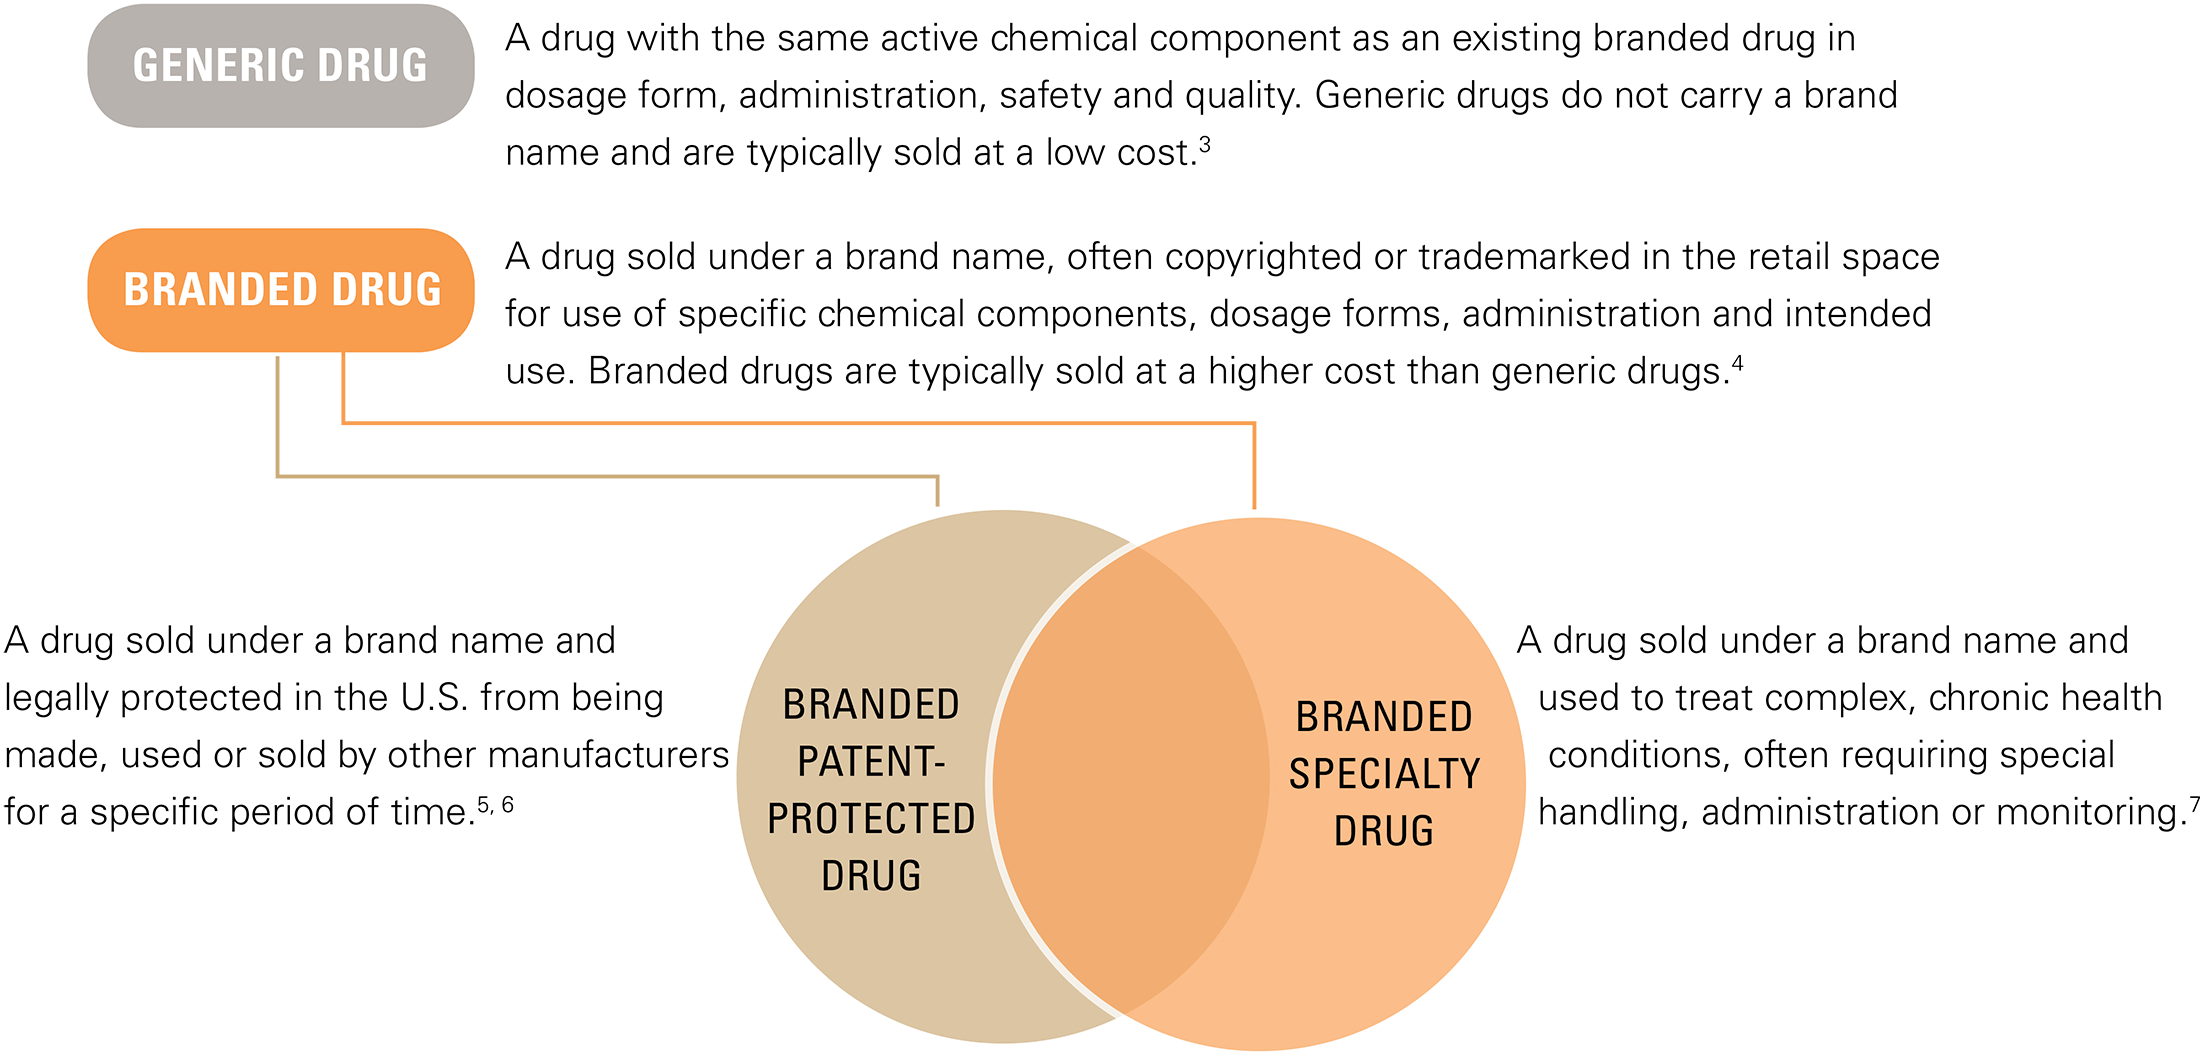
In addition to claims data from BCBS members, this study also leveraged external data sources. The information on patents was obtained from the FDA website (as of July 2018) and then matched with the claims data based on New Drug Application Numbers and National Drug Codes. This report defines branded patent-protected drugs as drugs legally protected in the U.S. from being made, used or sold by other manufacturers for a specific period of time. According to the FDA, exclusivity of branded patent-protected drugs “refers to certain delays and prohibitions on approval of competitor drugs available under the statute that attach upon approval of a drug or of certain supplements.”
Specialty drugs were identified by referencing the CVS Comprehensive Specialty Pharmacy Drug List (as of April 2018) and in consultation with the University of Maryland School of Pharmacy. This report defines branded specialty drugs as drugs sold under a brand name and used to treat complex, chronic health conditions, often requiring special handling, administration or monitoring.
Each of the independently owned and locally operated BCBS companies helps members maximize their prescription coverage to get the drugs they need at the most affordable cost. For example, BCBS members are encouraged to use generic prescription medicines, mail order delivery and home infusion, when available, and follow medication plans as prescribed by their doctors.9
For more information and to read past reports from The Health of America Report series, visit www.bcbs.com/the-health-of-america/reports.
Endnotes
- In this report, total spending amounts were extrapolated to the entire 88 million BCBS commercially insured population in 2017 and are adjusted for membership growth in prior years.
- While the findings in this report do not include the impact of drug rebates, BCBS recognizes that drug rebate programs impact overall drug spending. The impact will depend on the total dollars of drug rebates available, the annual growth rate of drug rebates and the ability of the drug rebate program to change market dynamics.
Using the Public Use Files from the Medical Loss Ratio reporting requirements as a proxy, BCBS has estimated a downward impact to the rate of drug spending experienced in the market in 2017 if rebates continued to grow in 2017 similar to rebate growth experienced in 2016 compared to 2015 and if other market dynamics are ignored. For example, in this report, brand drug spending increased by 4 percent. After consideration of drug rebates growth similar to 2016, the brand drug spending increase would be 1 to 2 percent, but importantly this estimate does not consider impacts beyond direct spending.
The reduction can only be applied to brand drug spending in this report and only to the most recent year experience. For more information, see: https://www.cms.gov/CCIIO/Resources/Data-Resources/mlr.html
- For more information from the U.S. Food and Drug Administration (FDA) on generic drugs, visit FDA.gov.
- For more information from the FDA on the differences between branded and generic drugs, visit FDA.gov.
- For more information on patents granted by the U.S. government, see: https://www.uspto.gov/patents-getting-started/general-information-concerning-patents
- In addition to patents, drugs can also obtain legal protection through “exclusivity” status from the FDA. The FDA defines “exclusivity” as “refer[ing] to certain delays and prohibitions on approval of competitor drugs available under the statute that attach upon approval of a drug or of certain supplements.” For more information, visit FDA.gov.
- To identify and define specialty drugs, this report utilized the CVS Comprehensive Specialty Pharmacy Drug List (April 2018) and consulted with the University of Maryland School of Pharmacy and CVS Health.
- In the 2017 Health of America Report, “single-source drugs” were defined as branded drugs that were the only option available within a drug class. In the 2018 Health of America Trend Update, this categorization was refined by using FDA information to classify branded drugs based as either “patent-protected” or “non-patent protected” as of January 1, 2018.
- To learn more about how BCBS companies are committed to providing access to safe, effective and affordable prescription drugs, see: https://www.bcbs.com/issues-indepth/providing-access-to-safe-effective-and-affordable-prescriptions and https://www.bcbs.com/sites/default/files/file-attachments/page/BCBS.DrugPricingAndAccess.pdf