
Executive Summary
In this report, the Blue Cross Blue Shield Association (BCBSA), in collaboration with Blue Health Intelligence (BHI), examines opioid prescription rates, opioid use patterns and opioid use disorder among commercially insured Blue Cross Blue Shield (BCBS) members (excluding members diagnosed with cancer or who were undergoing palliative or hospice care). In 2017, BCBSA released a report illustrating the impact of opioid use and opioid use disorder on the health of Americans. This analysis examines progress towards preventing inappropriate prescription opioid use.1,2
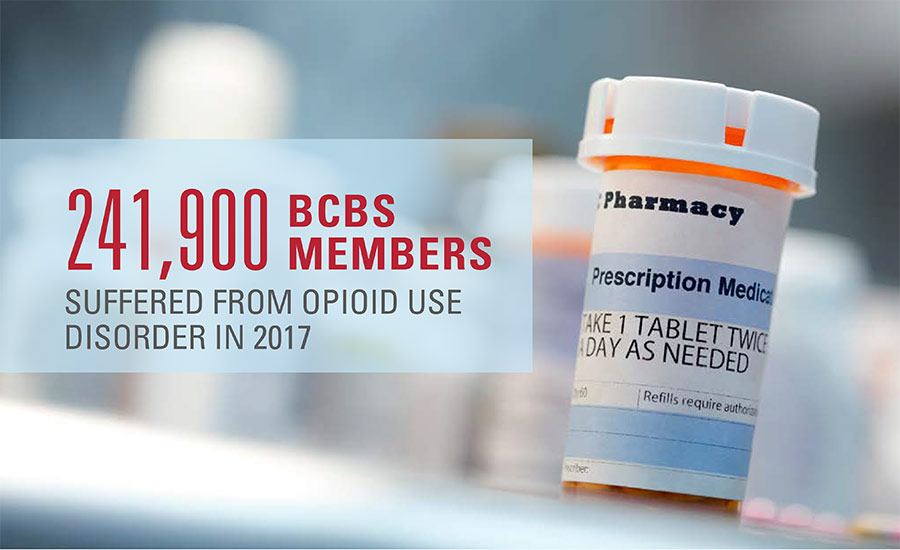
While progress has been made, there were 241,900 BCBS members diagnosed with opioid use disorder in 2017. Identifying evidence-based treatment for these members is a priority.
The opioid epidemic remains a critical health crisis in America. This report provides updated data-driven insights on the opioid epidemic.
Specific Findings
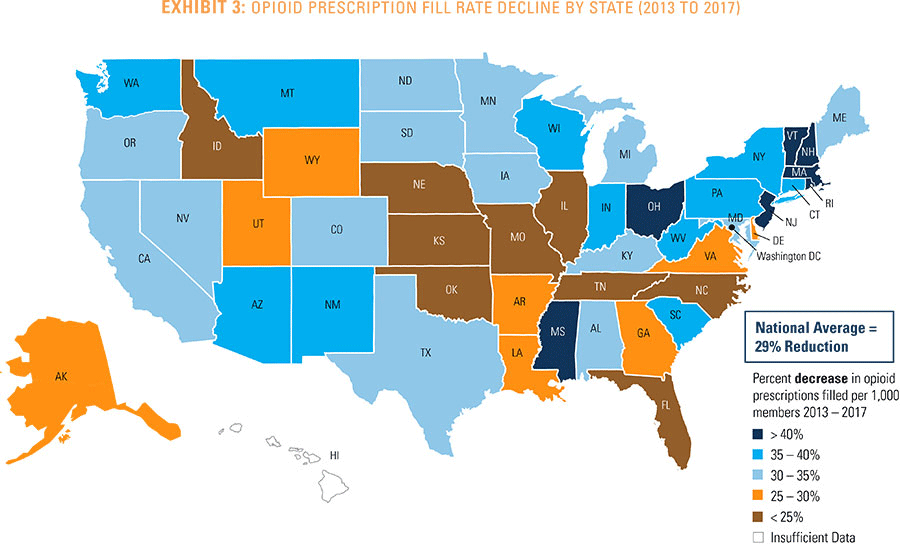
 Nationally, the total number of opioid medications filled by commercially insured BCBS members has declined by 29 percent since 2013, with significant variation among states. Thirty-four states had higher reductions, with Massachusetts leading at 51 percent.
- In 2017, 67 percent of BCBS members filled their first opioid prescription within the CDC-recommended guidelines for both dose and duration. Some states did significantly better than the average, led by Rhode Island at 80 percent, Mississippi at 74 percent and Vermont and Massachusetts at 73 percent.3
- When examining total opioid prescriptions for BCBS members in 2017, not just the first prescription, 45 percent of members filled prescriptions within the CDC-recommended dose and duration guidelines, up from 39 percent in 2013.
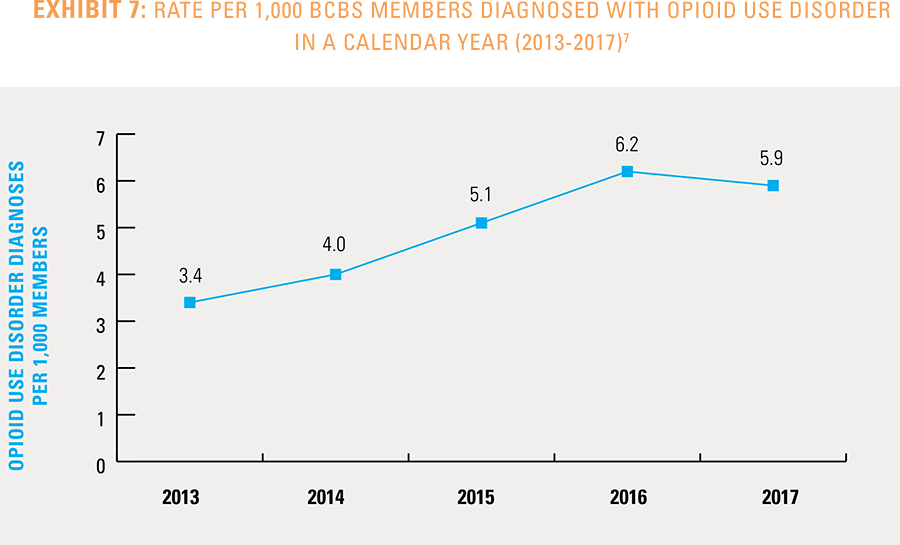
- In 2016, opioid use disorder claims stabilized, with 6.2 in 1,000 BCBS members diagnosed. The rate dipped slightly to 5.9 in 1,000 members in 2017.
Opioid Prescription Rates
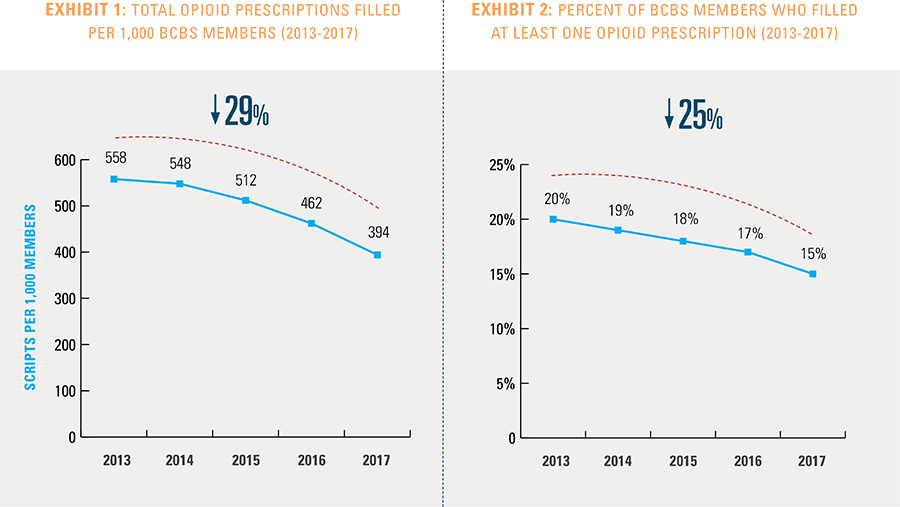
Significant efforts were made to reduce the use of opioid prescriptions by Americans. One way to measure these gains is to count the number of opioid prescriptions filled. For BCBS members nationally, the overall number of opioid prescriptions has declined significantly by 29 percent since 2013. The largest decrease in opioid prescriptions was seen in the past two years (see Exhibit 1). In addition, the number of BCBS members who filled at least one opioid prescription is down by 25 percent since 2013 (see Exhibit 2).
Wide geographic variation exists across the nation in the decline rates of filled opioid prescriptions (see Exhibit 3). State-level opioid prescription rates show significant variation, with 34 states exceeding the national average decline in opioid prescriptions (29 percent). (See Appendices A and B for detailed information by state and metropolitan statistical area.)
States that show the greatest reductions in overall opioid prescribing rates include Massachusetts (51 percent), Rhode Island (46 percent), Mississippi (43 percent), Vermont (41 percent), New Hampshire (41 percent) and New Jersey (41 percent).
Opioid Use Patterns: Dose and Duration
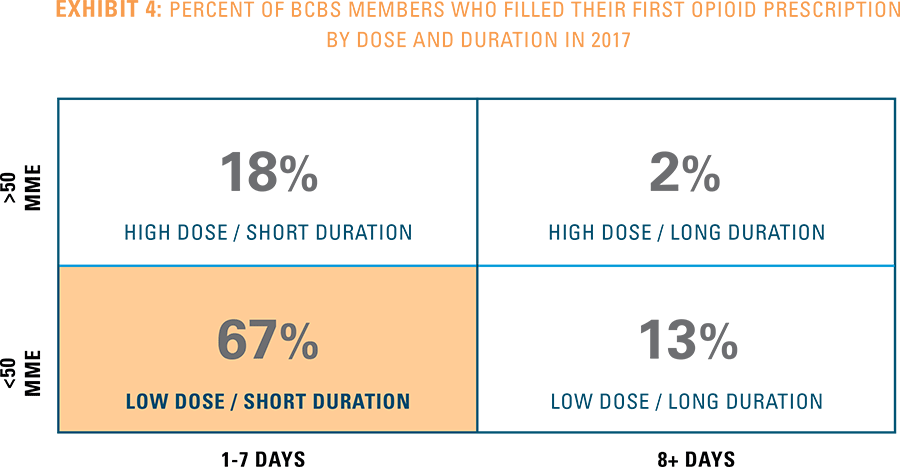
Progress has been made to reduce the dose and duration of opioid use among BCBS members who were prescribed at least one opioid in a calendar year. When medical professionals prescribe an opioid to a patient, the CDC recommends that the first prescription should have a duration of seven days or less and under 50 morphine milligram equivalents (MME) per dose.4 Any opioid prescription over these recommended guidelines is considered high dose and long duration.
Much of the published analysis on opioid prescribing has focused on first opioid prescriptions for either the prescription dose or duration. Two-thirds of BCBS members’ first prescriptions met the CDC-recommended guidelines for both dose and duration in 2017 (see Exhibit 4).5
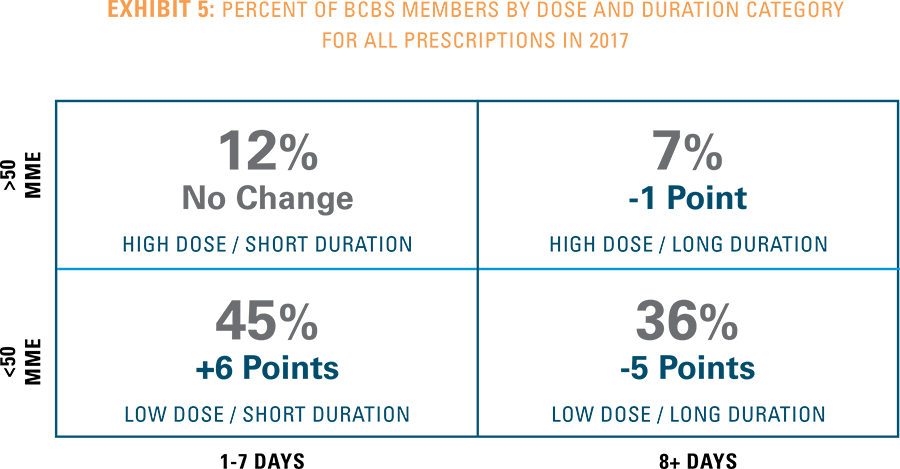
This analysis also introduces a new measure—the total dose and duration for a member filling multiple opioid prescriptions in a calendar year. This metric better identifies individuals at risk for opioid addiction. BCBS members whose total opioid use aligns with the CDC-recommended guidelines increased 6 percent since 2013 (see Exhibit 5). For 45 percent of BCBS members, opioid use was within the CDC-recommended guidelines for both dose and duration.6 More importantly, only 7 percent of BCBS members used opioids at a high dose and for a long duration.
Further, the dose and especially duration of an opioid prescription is strongly tied to the likelihood of a patient being diagnosed with opioid use disorder. Among the BCBS members diagnosed with opioid use disorder and still filling opioid prescriptions in 2017, 38 percent had average dosage levels greater than 50 MME, while 84 percent had total prescriptions lasting more than 7 days.
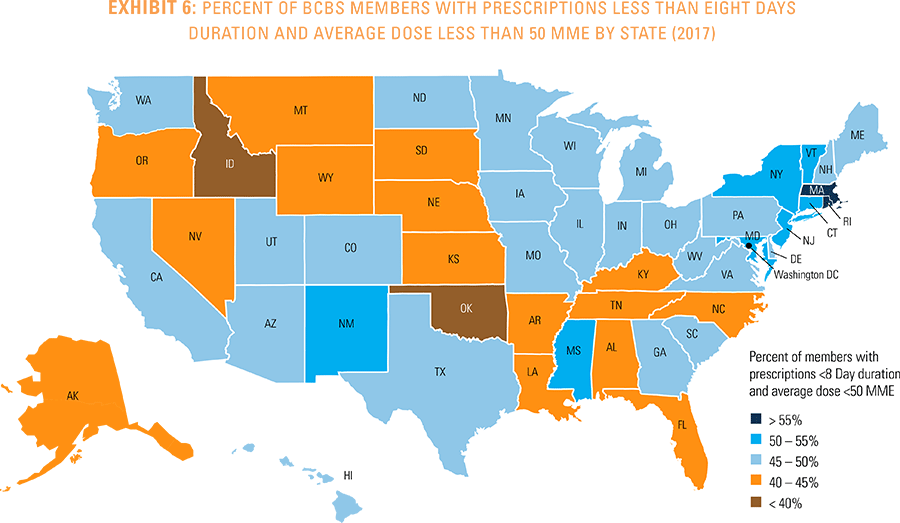
Nationwide analysis finds that more BCBS members received opioids in the lowest dose and duration category in the Northeast, Midwest and Southwest (see Exhibit 6).
While there have been significant gains in the number of BCBS members with prescriptions that meet the CDC-recommended opioid dose and duration guidelines, there is much work to be done to achieve full adherence for all opioid users.
Opioid Use Disorder
Opioid use disorder continues to impact thousands of Americans across the nation each year, including 241,900 BCBS members. In 2016, opioid use disorder claims stabilized, with 6.2 in 1,000 BCBS members diagnosed (see Exhibit 7). The rate dipped slightly to 5.9 in 1,000 members in 2017.
Further analysis of BCBS members diagnosed with opioid use disorder in 2017 indicates that men are more likely to become dependent on opioids, representing 59 percent of members diagnosed with opioid use disorder. Surprisingly, 68 percent of those with opioid use disorder in 2017 had no diagnosed pain condition within that year.
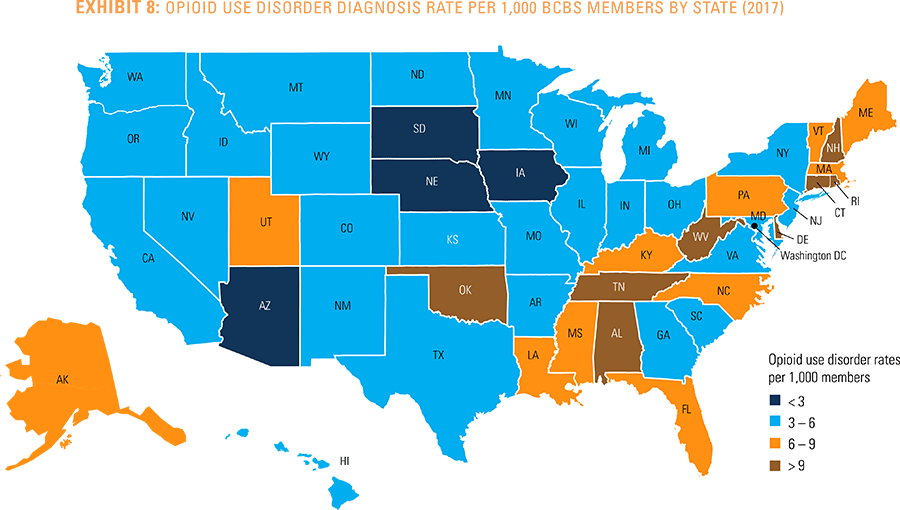
When viewing opioid use disorder diagnoses geographically, rates are higher in New England and the South. New Hampshire has the highest opioid use disorder diagnosis rate at about 12 per 1,000 BCBS members, while South Dakota has the lowest rate at about two per 1,000 BCBS members (see Exhibit 8).
Some states with higher rates of opioid use disorder also demonstrate above average reductions in the number of prescriptions filled from 2013 through 2017. This signals strong prevention efforts underway to curb opioid use in states such as Massachusetts, New Hampshire, West Virginia, New Mexico and Alabama.
Conclusion
Continued emphasis on this national crisis is needed to further reduce opioid consumption and dependency in the U.S. This report aims to provide support to public and private partners who are addressing this widespread epidemic. While this report demonstrates a reduction in the number of filled opioid prescriptions, it also underscores the substantial number of Americans diagnosed with opioid use disorder, including 241,900 BCBS members. To diminish inappropriate prescription opioid use across the U.S., continued focus remains on curbing inappropriate opioid prescriptions, as well as providing access to effective treatment for all Americans suffering from opioid use disorder.
Methodology Notes
This is the 21st study of the Blue Cross Blue Shield, The Health of America Report series, a collaboration between Blue Cross Blue Shield Association and Blue Health Intelligence, which uses a market-leading claims database to uncover key trends and insights into healthcare affordability and access to care.
The report examines the medical and pharmacy claims of more than 41 million BCBS commercially insured members per year from 2013 to 2017. BCBS members with a diagnosis of cancer or who are receiving services for palliative or hospice care were excluded. All other eligible BCBS members under age 65 were included in this analysis.
Prescription data was used to estimate raw opioid prescription counts and opioid prescription dose and duration. Prescription counts were treated equally regardless of the dosage or length of time of the prescription. Member-level dose and duration were calculated based on taking the average MME dosage and total prescription days for all prescriptions a member received within a calendar year.
Medical claims were used to measure the number of BCBS members with an ICD code-based diagnosis of opioid use disorder. Rates were computed on a per 1,000 member basis or percentage basis, where noted.
For more information and to read past reports from The Health of America Report series, visit https://www.bcbs.com/the-health-of-america/reports